Toronto Metropolitan University (TMU) Wireless Service Renewal and Expansion

Introduction
Since the 2007-2008 academic year, increasing use of smartphones and laptops on campus has resulted in dramatically increased demand for wireless services. Even where wireless service had been provided to cover high-use areas like the Library and TRSM, at times (especially in the Winter 2012 term), the number of devices has overwhelmed the available access points(radios). Some access point models are only able to handle roughly 30 wireless connections at a time but may receive over 100 concurrent connection requests. In response, CCS has been increasing the number of wireless access points across campus and is replacing older models with newer and more capable ones. This page provides information on TMU's expanding wireless network as well as some background information on wireless use on campus.
Total number of access points
| Time | Total Access Points |
|---|---|
| End of February 2012 | 1115 |
| End of Summer 2013 | 1493 |
| End of Fall 2013 | 1603 |
| End of April 2014 | 1619 |
| End of Summer 2014 | 1757 |
| End of 2014 | 1770 |
| End of October 2015 | 2103 |
| End of February 2016 | 2133 |
| End of August 2016 | 2269 |
| End of December 2016 | 3046 |
| End of July 2017 | 3090 |
| End of September 2017 | 3197 |
| End of March 2018 | 3222 |
| End of June 2018 |
3473 |
| End of January 2020 | 4546 |
| End of August 2020 | 4616 |
| End of August 2021 |
4751 |
| End of August 2022 |
4525 |
| End of August 2023 |
4495 |
| End of September 2024 |
4602 |
| End of September 2025 | 4812 |
*During the Fall 2013 term, CCS undertook a major network infrastructure upgrade in TRS that includes replacing wireless access points with new series 220 access points. The new devices can support more connections and provide greater bandwidth - especially in high demand areas.
Access Point Upgrades
TMU began installing the Aruba Networks 60 series access points in 2004 and has since moved to installing series 130 access points in low-to-medium demand areas and series 220 access points in higher demand areas. The following table provides a rough comparison between the different types of access points.
Access point model capacity
| Model | 635 Series | 535 Series | 325 Series | 220 Series | 130 Series | 100 Series |
|---|---|---|---|---|---|---|
| Max Connections | 1024 per radio | 512 per radio | 200 | 100 | 70 | 30 |
| Max Shared Bandwidth Available | 3.9 Gbps | 2.97 Gbps | 1.3 Gbps | 950 Mbps | 450 Mbps | 300 Mbps |
| Standard | a/b/g/n/ac/ax (WIFI 6E) | a/b/g/n/ac/ax (WIFI 6) |
a/b/g/n/ac | a/b/g/n/ac |
a/b/g/n | a/b/g/n |
Note: the actual number of connections and bandwidth available on an access point will vary depending on factors like distance to the access point, radio interference, and bandwidth demands from each wireless device.
Even under near ideal circumstances wireless bandwidth is normally shared between many devices and is rarely as good as a wired connection. If you have access to a wired connection in an office or classroom podium, CCS strongly recommends you use the wired connection for the best possible reliability and performance.
Increasing Demand for Wireless
The following table shows the year-by-year increase in the peak number of wireless devices simultaneously connected to TMU's wireless network.
Peak of wireless devices simultaneously connected
| Year | Peak Daily Wifi Connections |
|---|---|
| 2008 - 2009 | 2,500 |
| 2009 - 2010 | 4,500 |
| 2010 - 2011 |
6,000 |
| 2011 - 2012 | 7,000 |
| 2012 - 2013 | 9,200 |
| 2013 - 2014 | 9,636 |
| 2014 - 2015 | 15,000 |
| 2015 - 2016 | 25,947 |
| 2016 - 2017 | 32,500 |
| 2017 - 2018 | 32,732 |
| 2018 - 2019 | 33,772 |
| 2019 - 2020 | 37,212 |
| 2022 - 2023 | 27,061 |
| 2023 - 2024 | 30,986 |
| 2024 - 2025 | 34,575 |
| 2025 - 2026 | 33,847 |
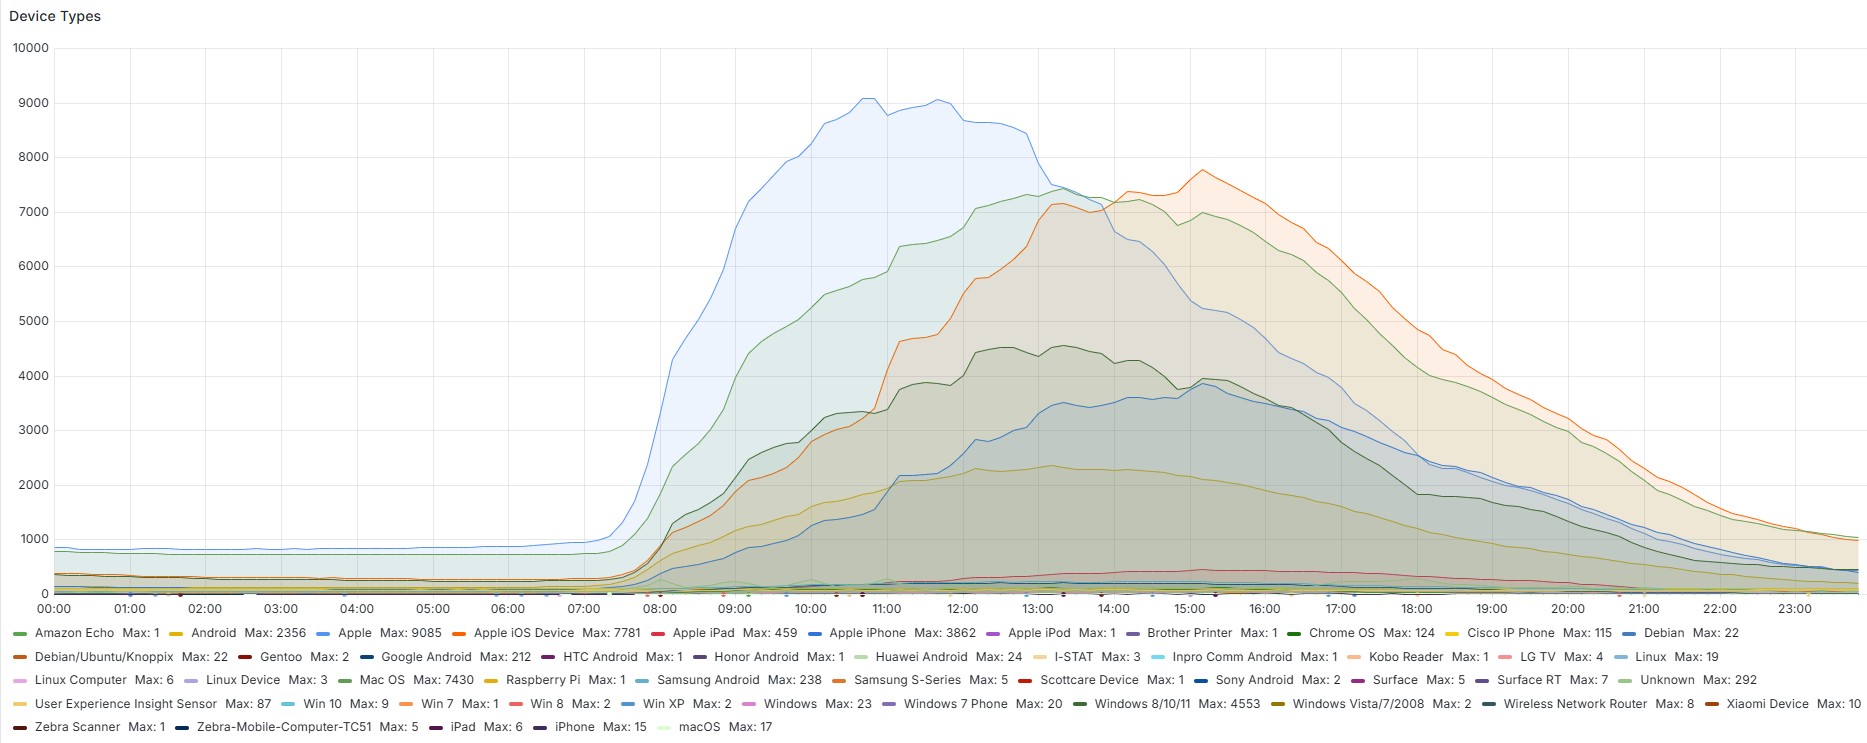
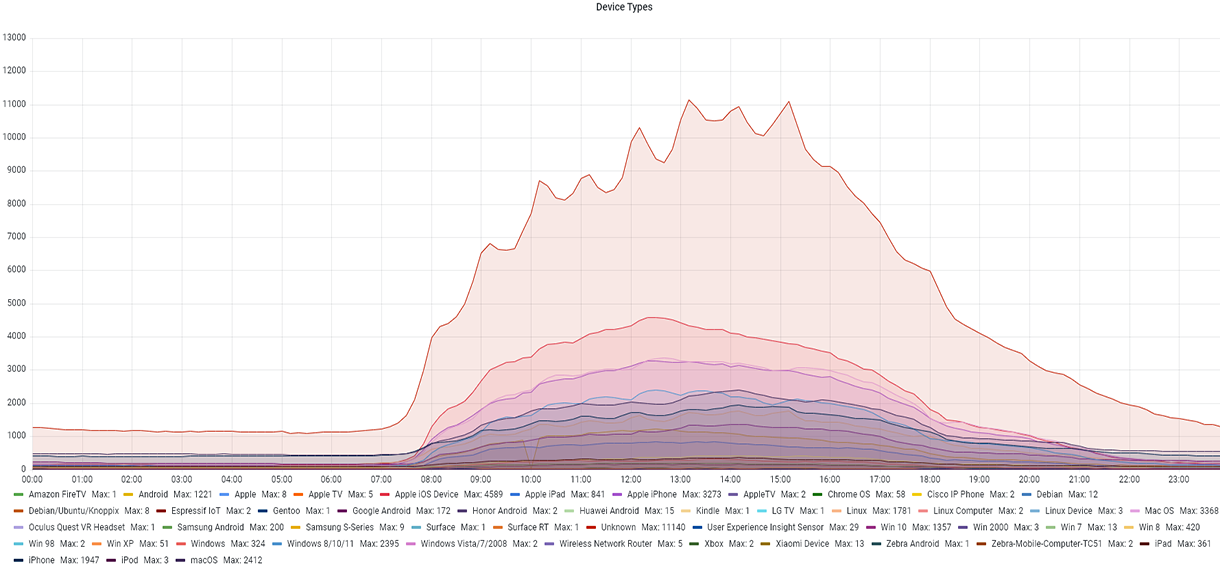
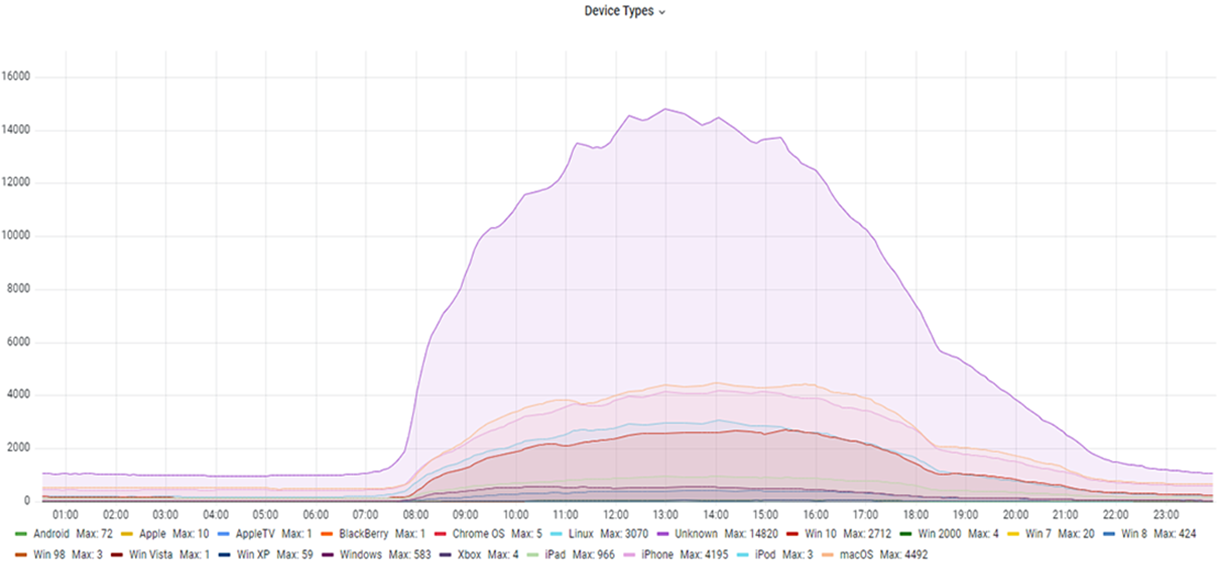
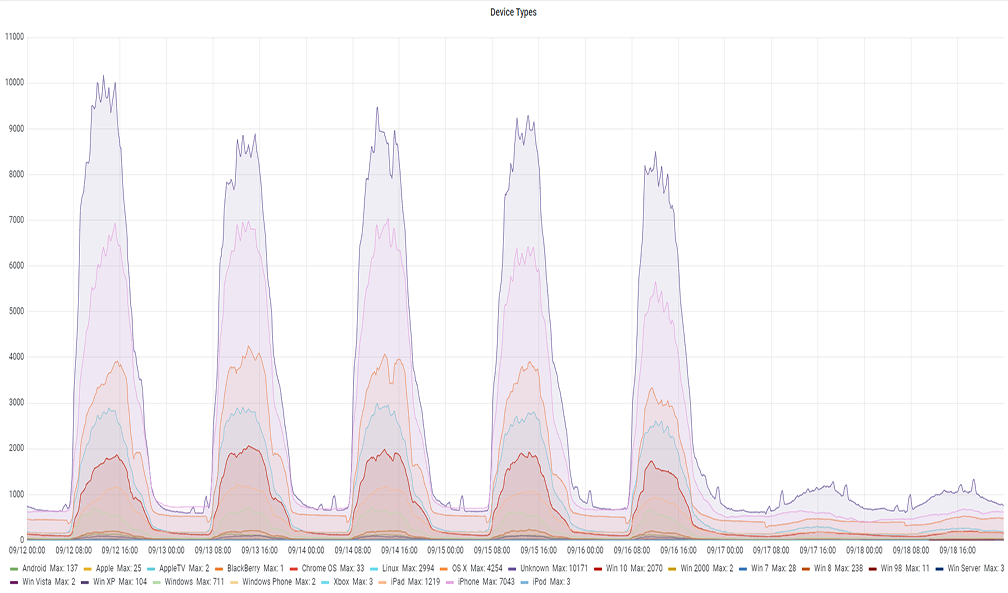
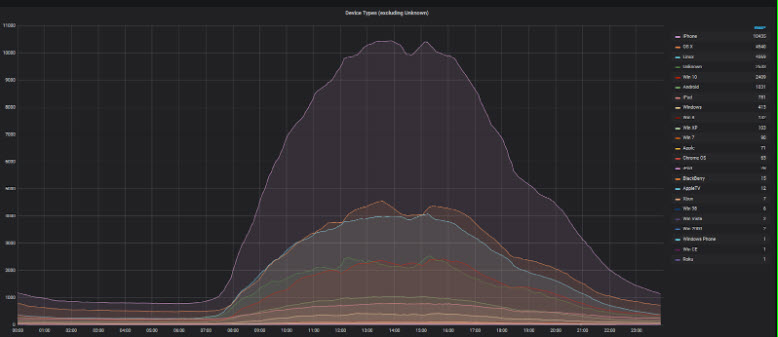
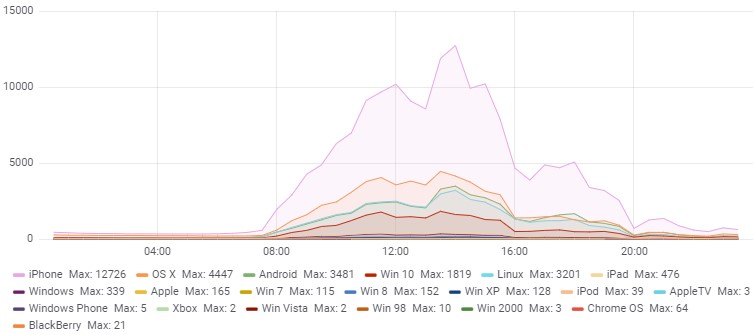
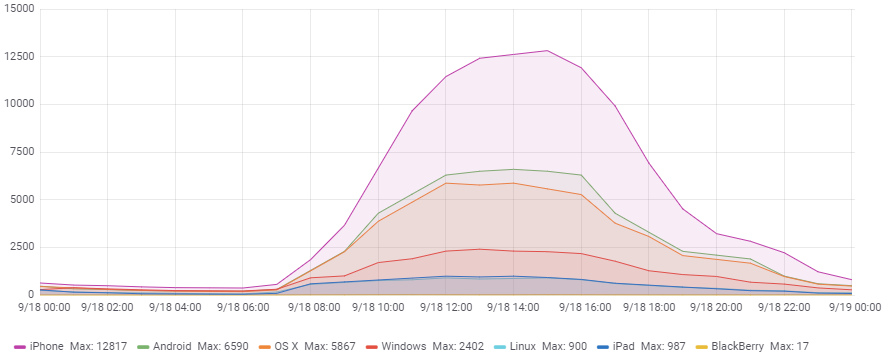
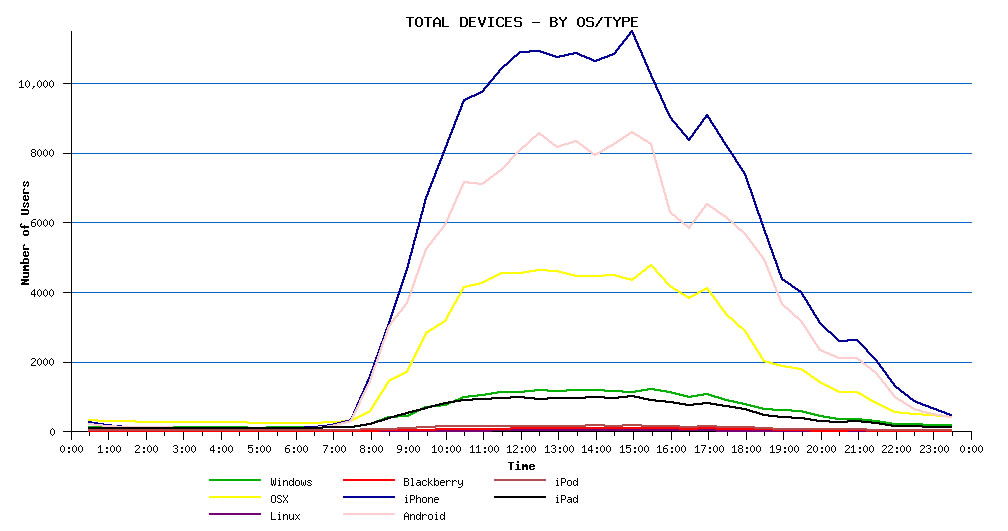
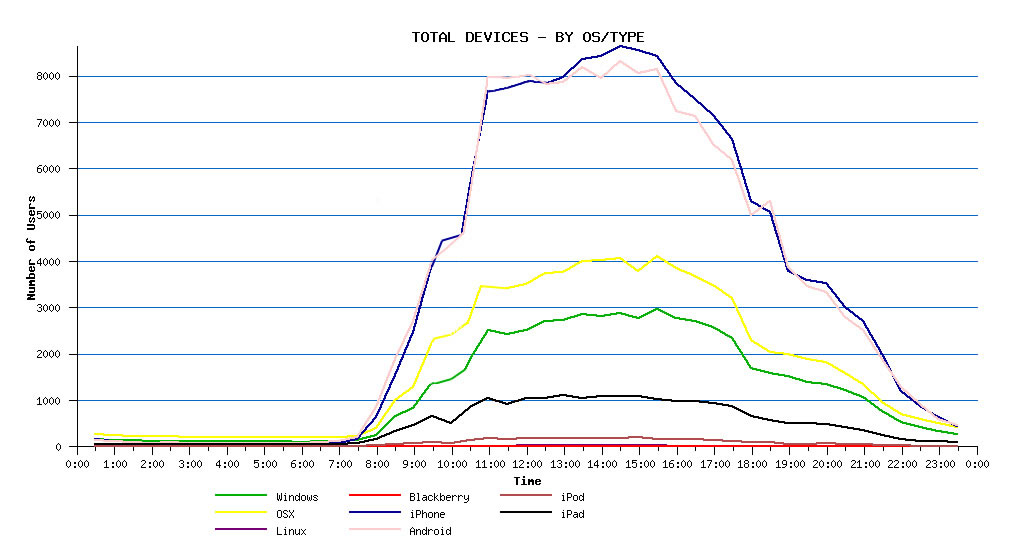
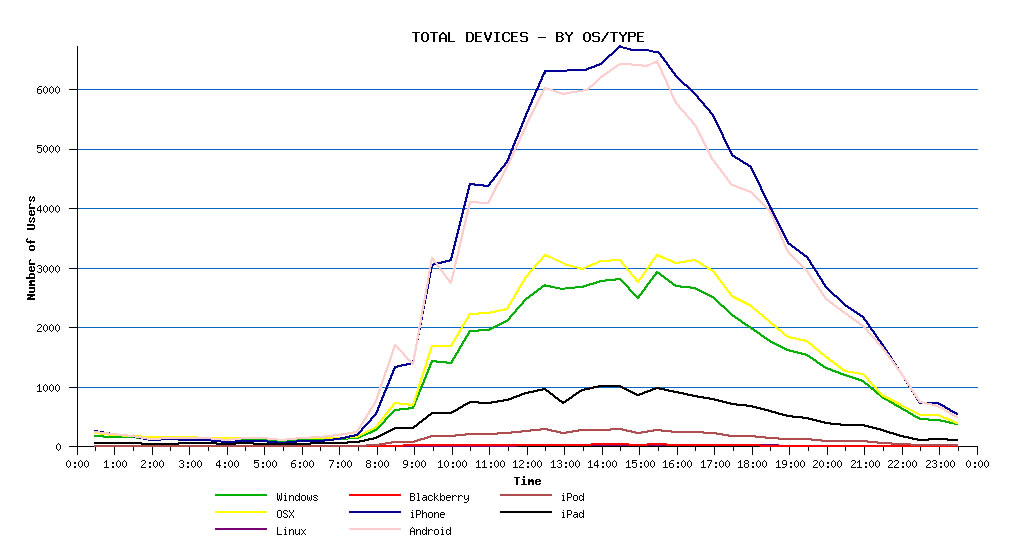
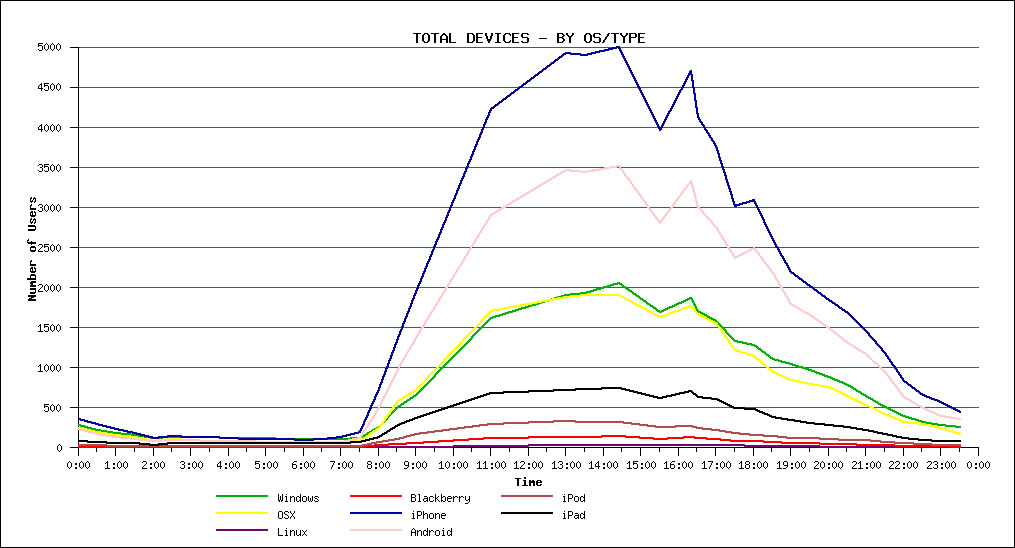
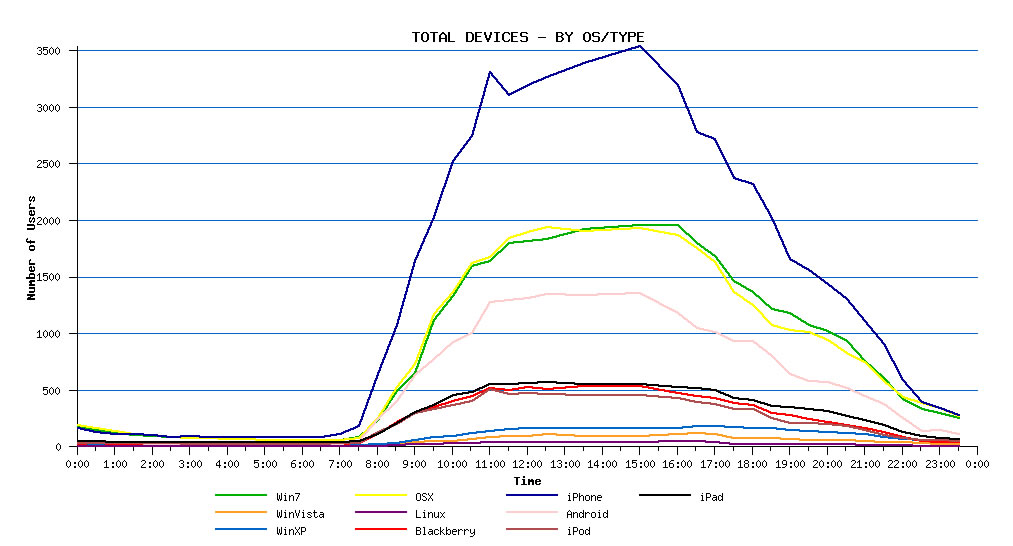
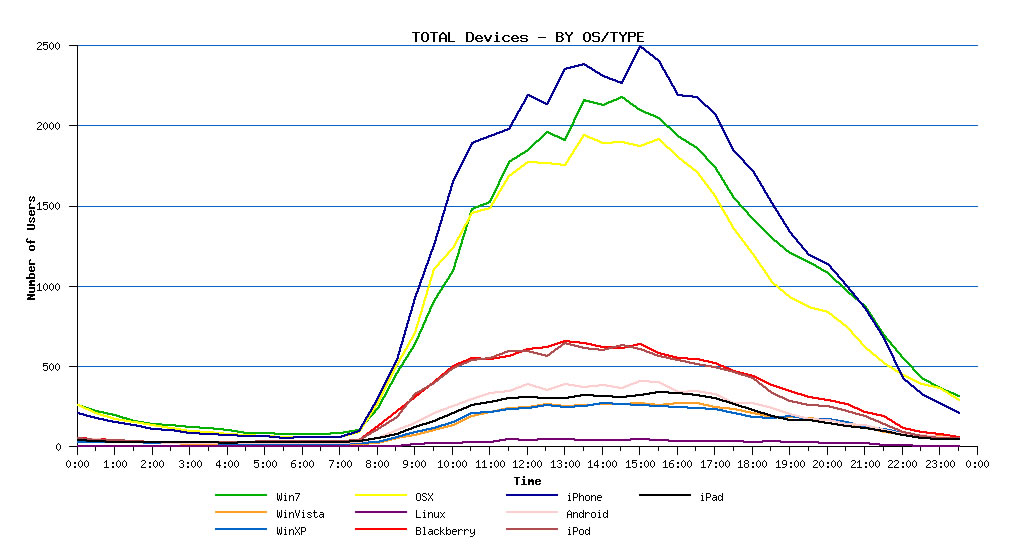
The following graphs show the change from Fall 2011 to Fall 2025 in terms of the types of and numbers of devices connected to TMU’s wireless network. Select the image to enlarge.