Toronto No Longer Fastest-Growing Metropolitan Area in Canada and U.S.
Falling from 1st to 412th in 2025
By: Diana Petramala, Senior Economist and Frank Clayton, Senior Research Fellow
Updated July 9, 2026
(PDF file) Print-friendly version available
CUR has been tracking population growth across metropolitan areas in Canada (CMAs) and the U.S. (MSAs) since 2020. With the exception of the pandemic, Toronto had consistently ranked as one of the fastest-growing metropolitan areas in Canada and the U.S. – until 2025.
This blog compares population growth across Canadian and U.S. metropolitan areas in 2025, based on population estimates from Statistics Canada and the U.S. Census Bureau. Growth reflects the 12 months ending July 1, 2025.
Calgary and Edmonton are only Canadian metro areas in the top 10
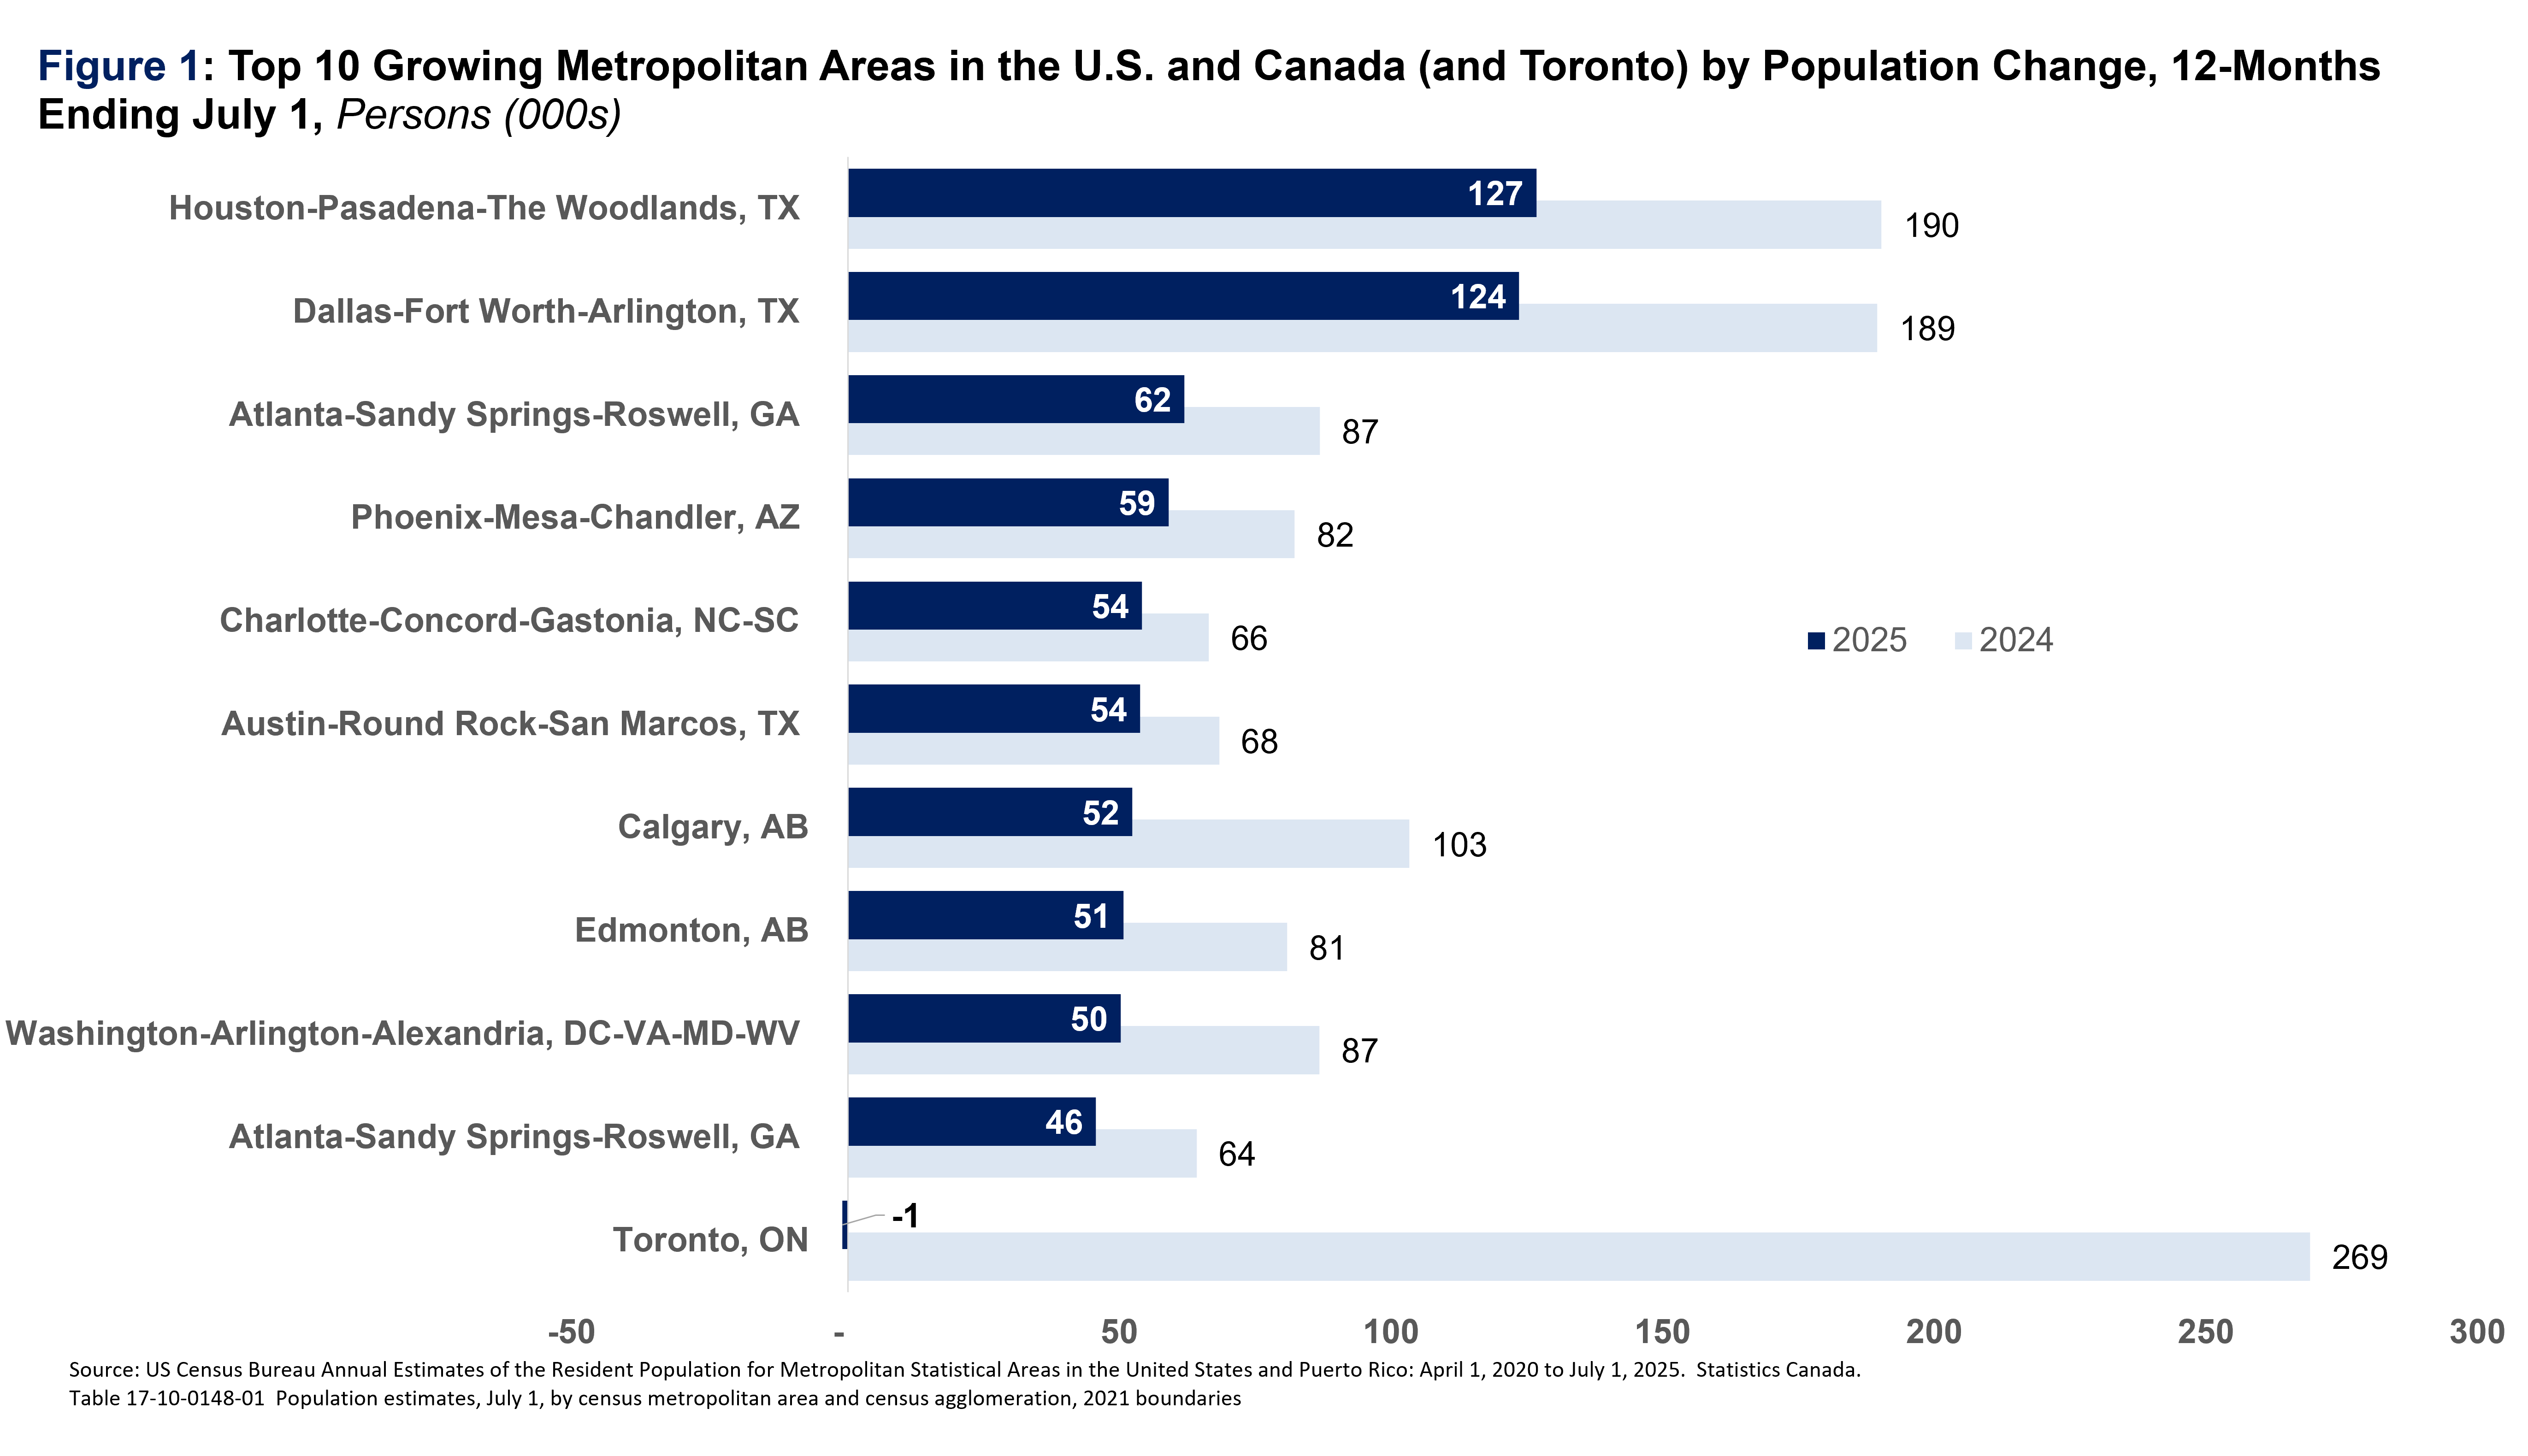
Figure 1 shows the ten fastest-growing metropolitan areas (by absolute population growth) in Canada and the U.S. in 2025, along with growth in the previous year. Toronto is included for comparison.
Houston and Dallas were the top growing municipalities in 2025. Calgary (#7) and Edmonton (#8) were the only Canadian metropolitan areas to make the top ten in 2025. Toronto ranked 412th out of 435 metropolitan areas, after ranking first in 2024 during a year of record population growth caused by a tidal wave of immigration.
Montreal (#25) and Vancouver (#92) also fell sharply in the rankings after placing 5th and 6th, respectively, in 2024.
Large domestic outflows weigh on Toronto’s ranking
At first glance, one might assume Toronto’s sharp drop in the rankings was driven by lower federal immigration targets. Not quite.
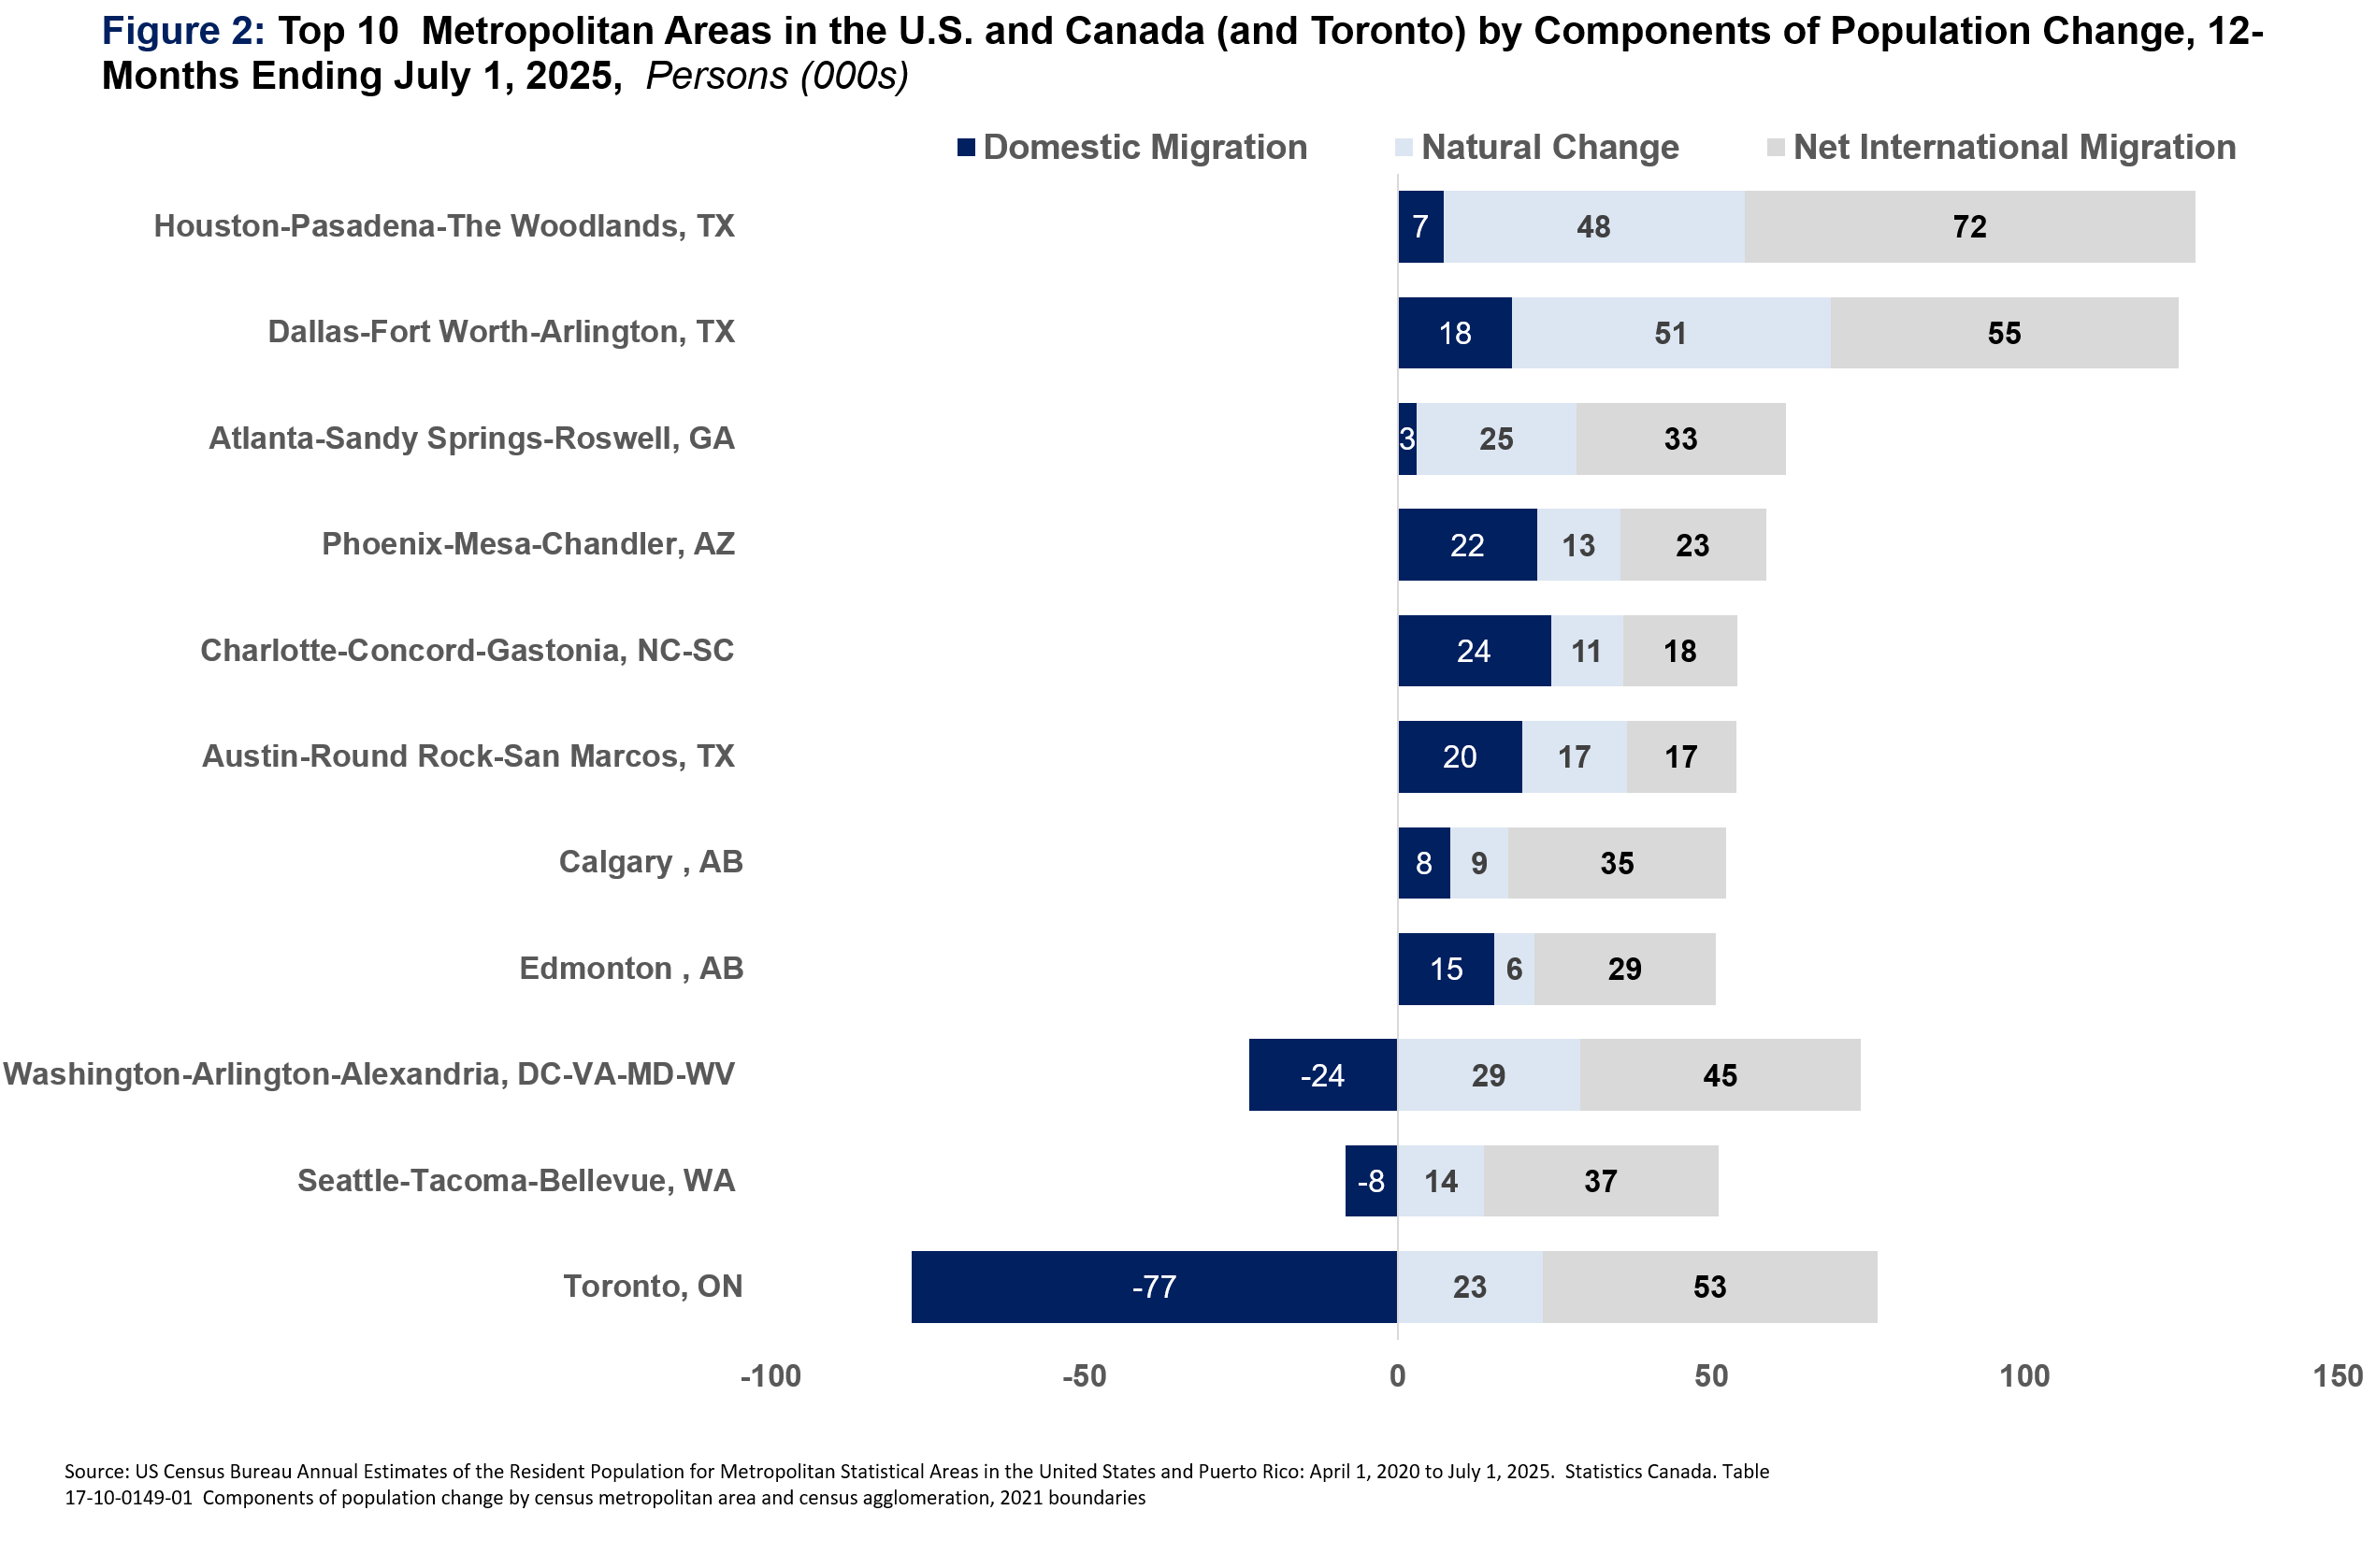
Figure 2 breaks population growth in 2025 into its major components: natural increase (births minus deaths), net domestic migration, and net international migration.
Despite a sharp reduction in immigration relative to 2024, Toronto still continued to post one of the strongest rates of international migration among the fastest-growing metropolitan areas. However, the region also continued to lose residents to other parts of Canada at a very high rate, resulting in negative net domestic migration (through inter and intra-provincial migration).
Meanwhile, Texas remains the top metropolitan destination for Americans and international newcomers looking for a new home.
Toronto and Montreal still on top 10 list for net inflows from abroad – New York City, Miami, and Houston top U.S. metro areas
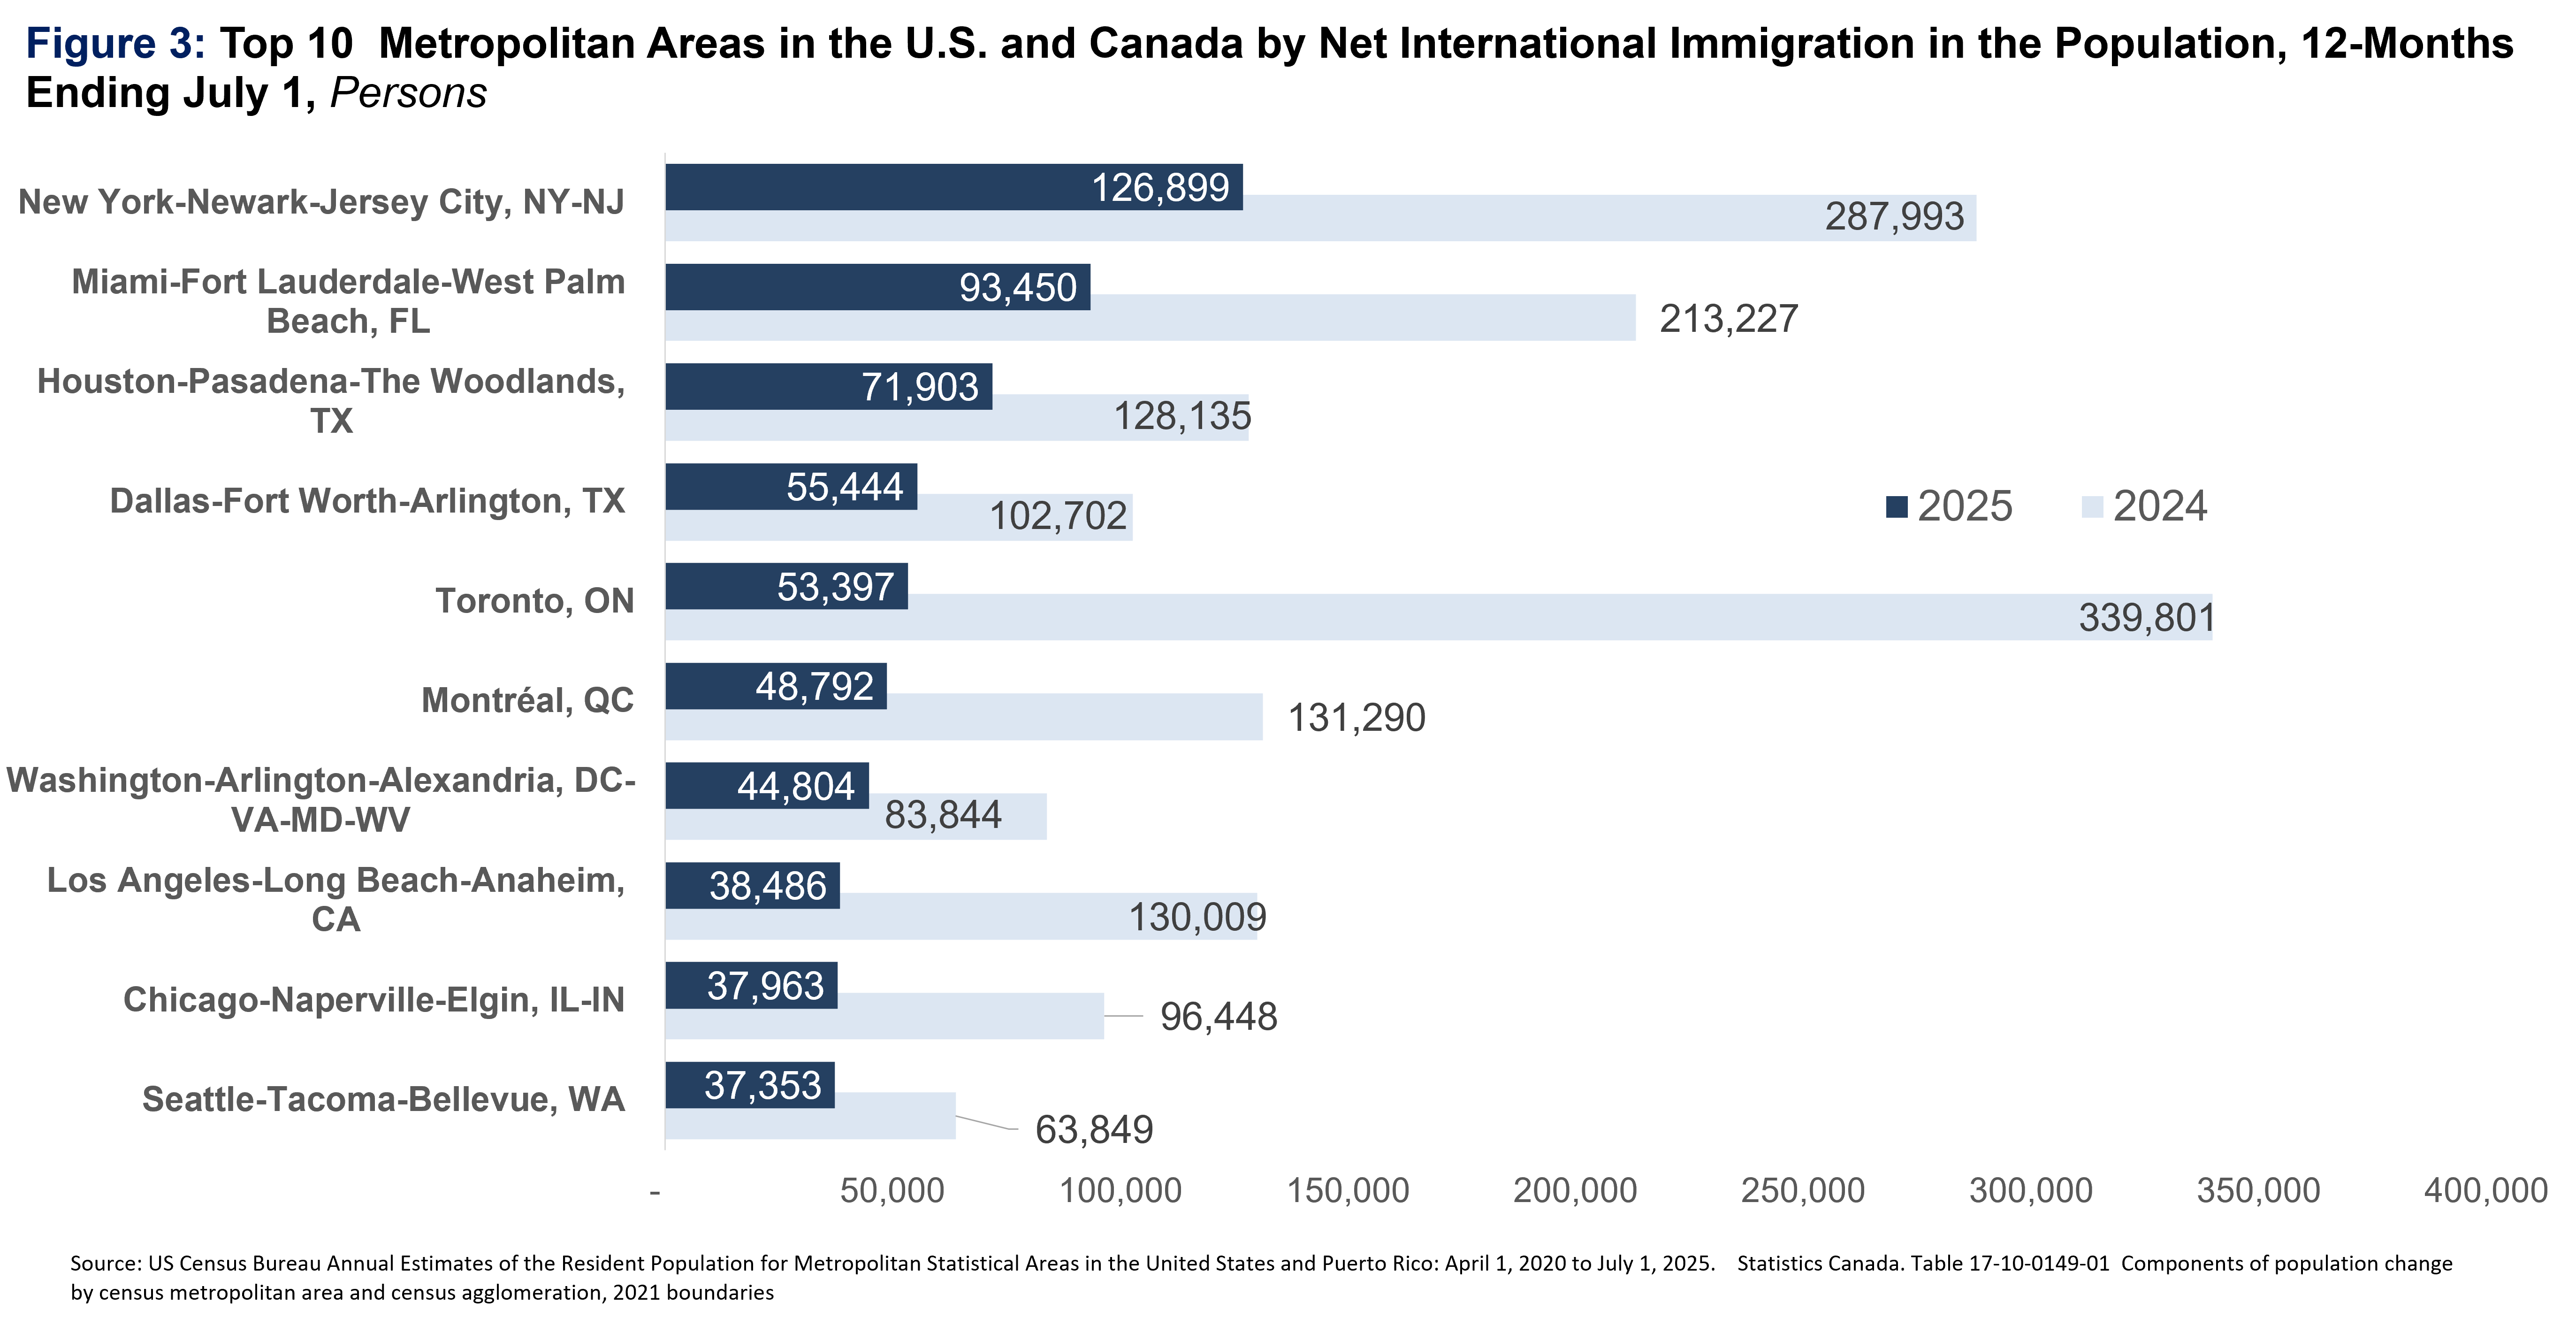
For those curious, Figure 3 shows the top ten metropolitan areas for net international migration in 2025. Toronto and Montreal remained the top Canadian landing spots for newcomers (#5 and #6, respectively), while metropolitan areas in Texas, Florida, and New York dominated the U.S. rankings.
Interestingly much more restrictive immigrant policies caused marked year-to-year declines in net immigration in all of the top ten metropolitan areas.
No Canadian metro area made the top 10 list for net domestic migration
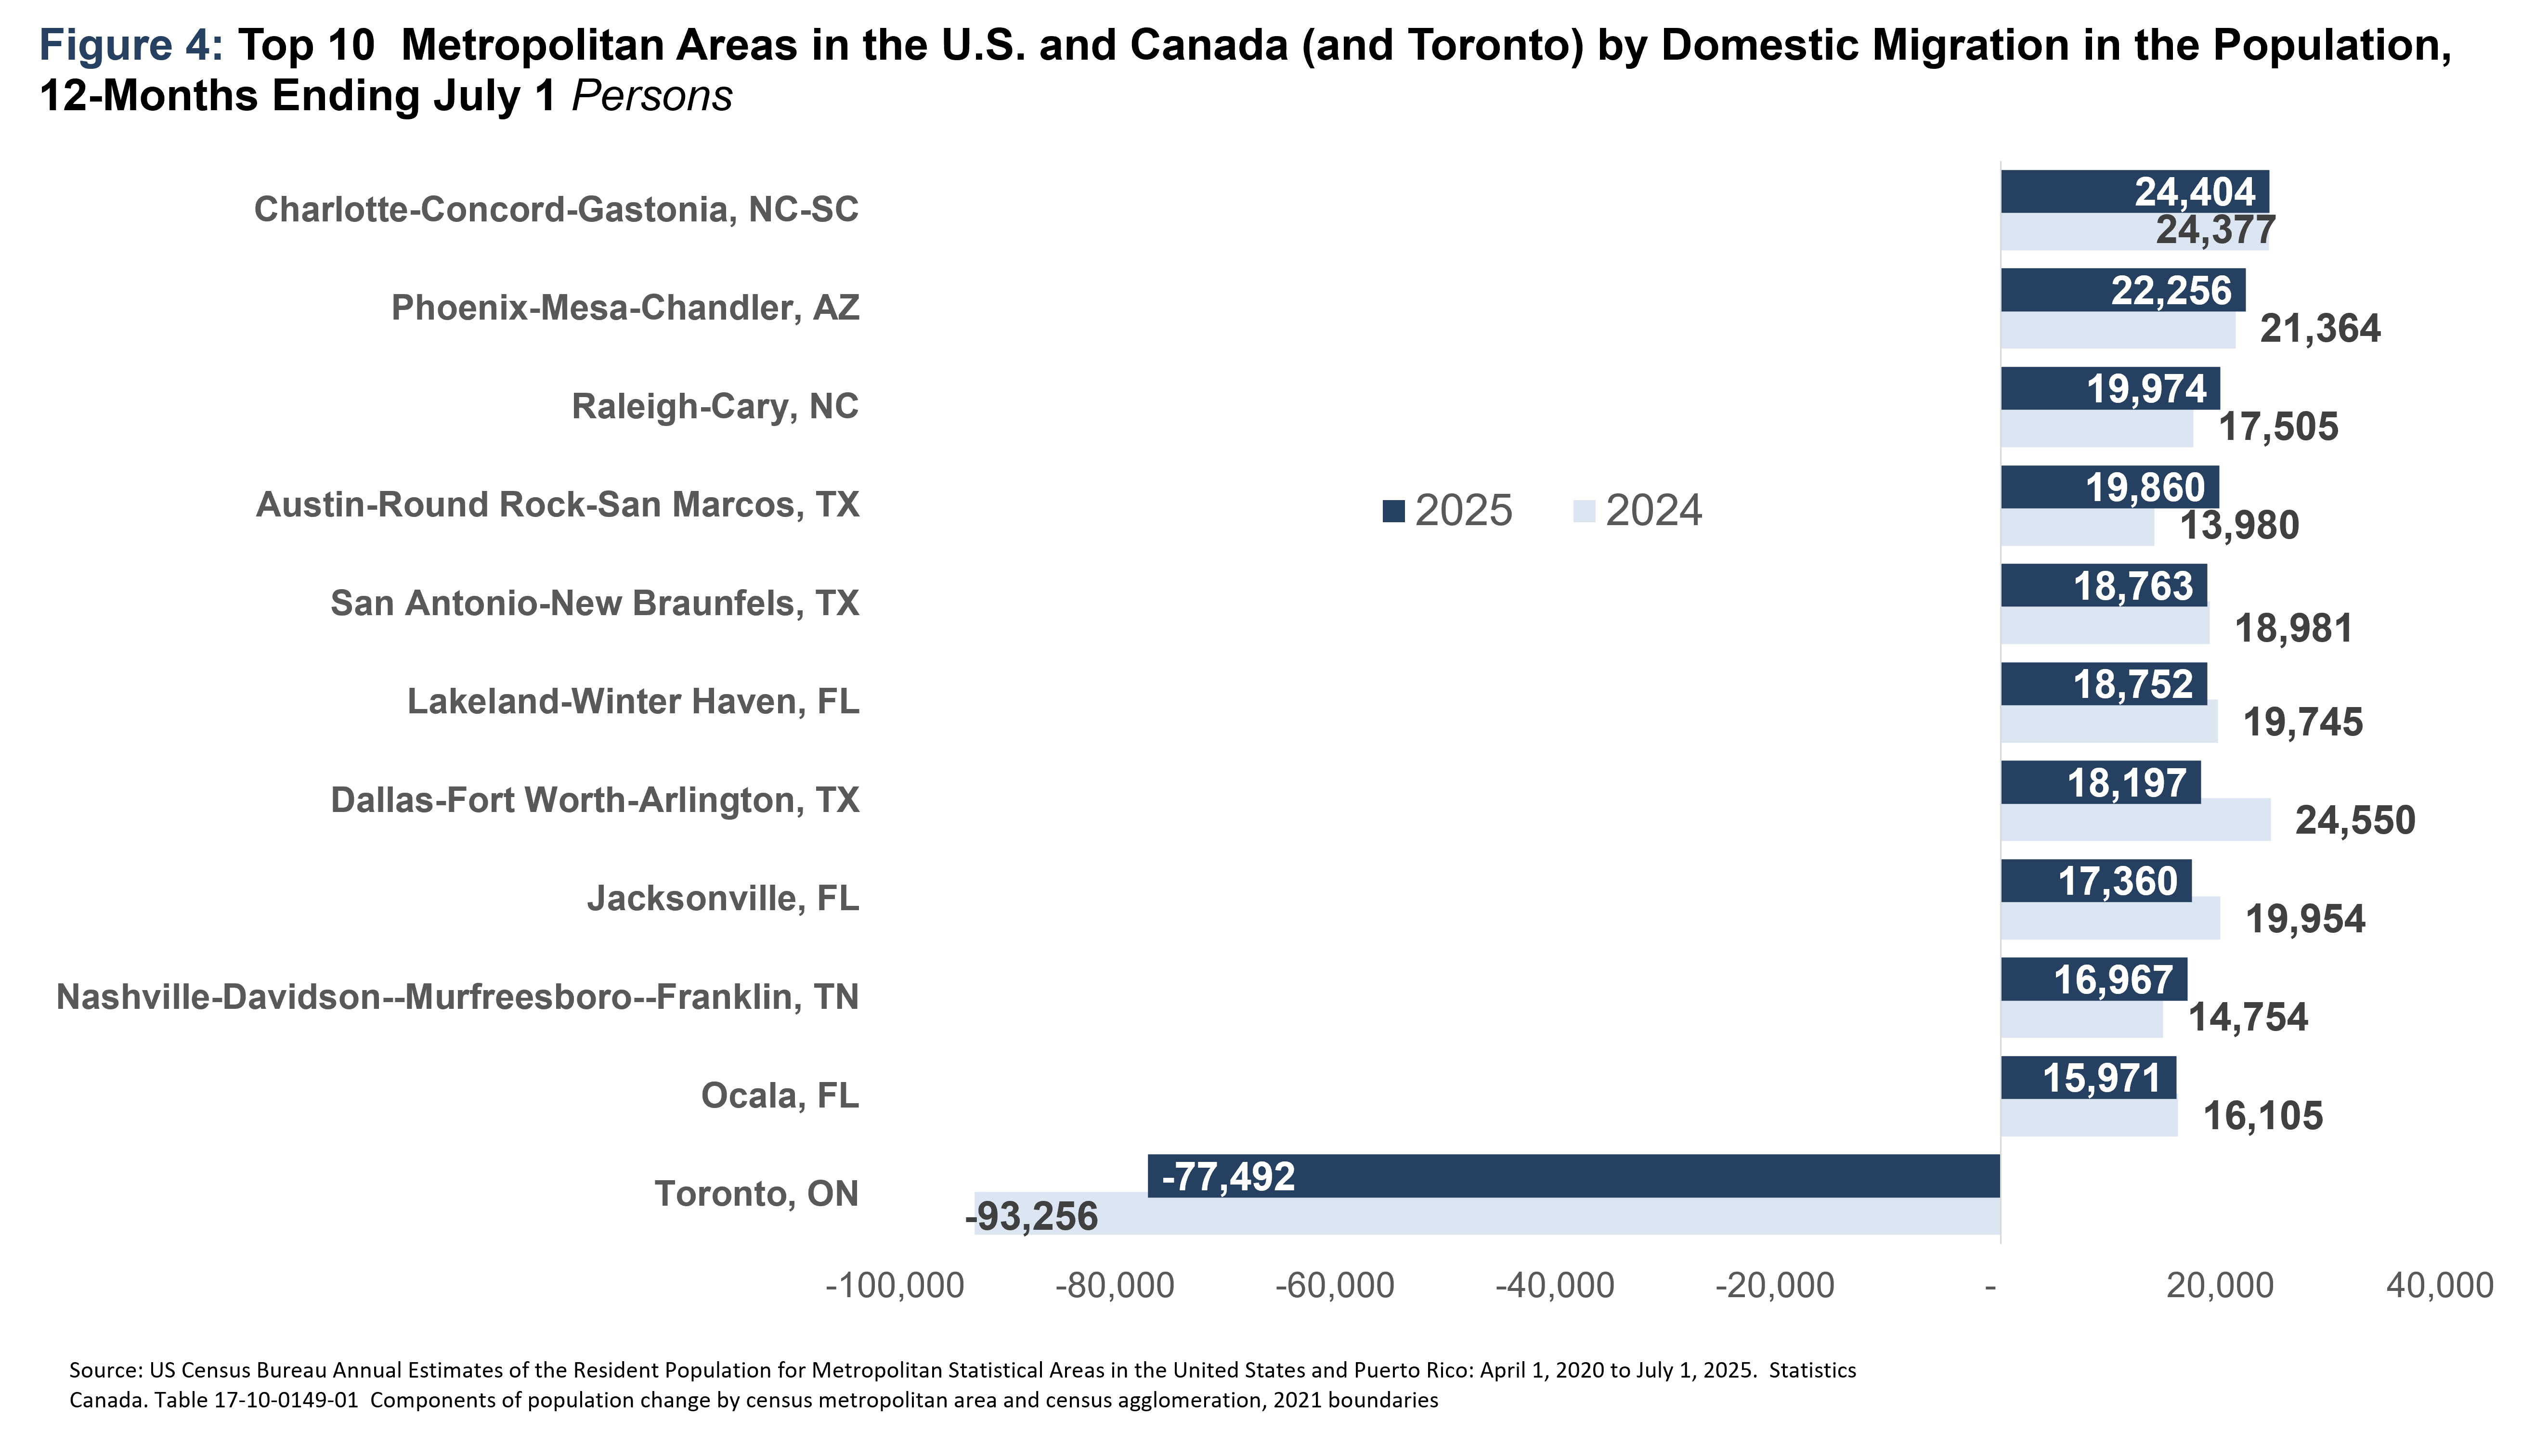
Figure 4 shows the top ten metropolitan areas for net domestic migration in 2025. Net domestic migration combines net intraprovincial/state and interprovincial/state migration. The list is dominated by U.S. metropolitan areas, especially in Texas and Florida. Not a single Canadian metropolitan area made the top ranking!
Conclusion
Toronto’s sharp population slowdown reflects a combination of factors, including a reduction in immigration. However, the city’s rank among other North American cities reflects sharp trends in out-migration of its existing population.
As the region attracted newcomers from around the world at lower rates than in 2024, increasingly unaffordable housing appears to be pushing many residents to other parts of Canada.
References
Statistics Canada. Table 17-10-0148-01 Population estimates, July 1, by census metropolitan area and census agglomeration, 2021 boundaries. [Online] Available: https://www150.statcan.gc.ca/t1/tbl1/en/tv.action?pid=1710014801 (external link) .
Statistics Canada. Table 17-10-0149-01 Components of population change by census metropolitan area and census agglomeration, 2021 boundaries. [Online]. Available: https://www150.statcan.gc.ca/t1/tbl1/en/tv.action?pid=1710014901 (external link) .
U.S. Census Bureau, Population Division. Annual and Cumulative Estimates of the Components of Resident Population Change for Metropolitan Statistical Areas in the United States: April 1, 2020 to July 1, 2025. [Online]. Available: https://www.census.gov/data/tables/time-series/demo/popest/2020s-total-metro-and-micro-statistical-areas.html (external link) .
U.S. Census Bureau, Population Division. Annual and Cumulative Estimates of the Components of Resident Population Change for Metropolitan Statistical Areas in the United States: April 1, 2020 to July 1, 2024. [Online]. Available: https://www.census.gov/newsroom/press-kits/2025/population-estimates-components-change-counties-metro-micro-puerto-rico.html (external link) .
U.S. Census Bureau, Population Division. Annual Estimates of the Resident Population for Metropolitan Statistical Areas in the United States and Puerto Rico: April 1, 2020 to July 1, 2025 (CBSA-MET-EST2024-POP). [Online]. Available: https://www.census.gov/data/tables/time-series/demo/popest/2020s-total-metro-and-micro-statistical-areas.html (external link) .
Appendix: Defining Canadian and U.S. Metropolitan Areas
A Canadian Census Metropolitan Area (CMA) consists of one or more adjacent municipalities centred on a population center (the core). A CMA must have a population of at least 100,000, of which 50,000 or more must live in the core. The adjacent areas to the urban core are included in the CMA if 50% of the resident population commutes into the core for work and 25% of the jobs are filled by commuters from the core or the municipality directly touches or is partly within the urban core.
A U.S. Metropolitan Statistical Area (MSA) includes a central county with at least 50% of its population living in an urban core with a population of 50,000 or more. Surrounding counties are included in the MSA if 25% of the resident population commutes into the central county(ies) for work and 25% of the jobs are filled by commuters from the central county(ies).
Because of the varying definitions, U.S. MSAs tend to be larger in geography and population than Canadian CMAs.