Making visual - and tangible - sense of scientific data
By creating large-scale visual models of complex datasets, which can be easily manipulated through tangible objects such as dials, professor Ali Mazalek (RTA School of Media) is hoping to inspire conversation and collaboration in novel and innovative ways that will fuel discovery in the healthcare arena.
Most recently, she collaborated with the Ontario Institute for Cancer Research (OICR), assisting scientists who were in the process of sequencing mitochondrial DNA and collecting clinical data from 350 prostate cancer patients. Through her Synaesthetic Media Lab - which includes postdoctoral researcher Roozbeh Manshaei, master’s student Sean DeLong, and undergraduates Nauman Baig and Shahin Khayyer - professor Mazalek and her team developed a tool to help cancer researchers analyze this clinical data, thereby enabling them to look at the differences between healthy cells and cancerous cells to compare the mutations.
"OICR had sequenced all this data and needed to make sense of it," said professor Mazalek. "They partnered with my lab, which builds human-computer interaction tools for working with large datasets using new technologies that let multiple people visualize and work with the data together around large displays and manipulate the data tangibly."
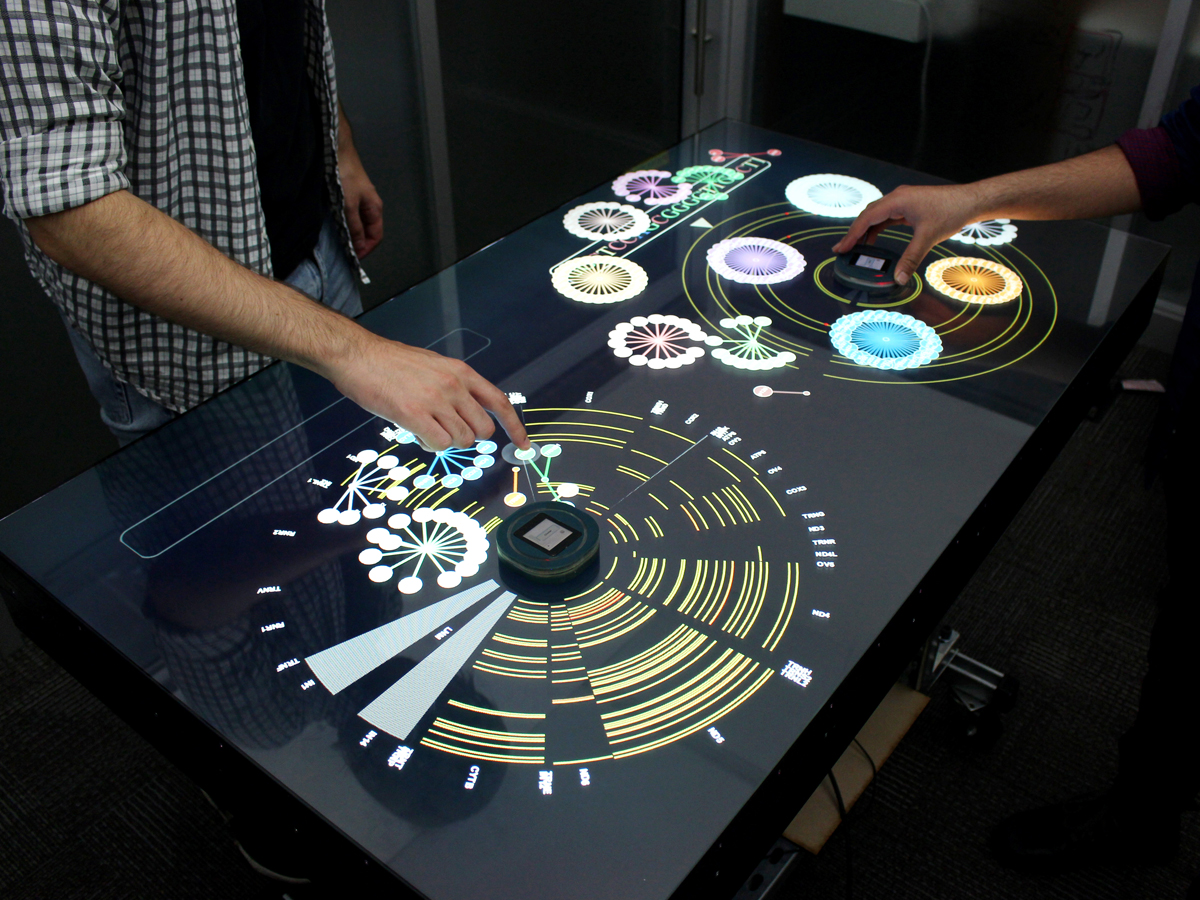
By creating an interactive digital tabletop that researchers can gather around and use collaboratively, professor Mazalek aims to improve communication and help researchers think outside the box. The tabletop features an interactive touchscreen that displays the data in diagrams that can be manipulated and moved through the use of tangible dials.
"The goal is to delve into the data, and filter and search through it in different ways," said professor Mazalek. "We hope it will help researchers gain insights and ask better, more targeted questions, like what data should be collected next, or which parts of the data are most relevant to look at in the context of a certain disease."
Using tangible and interactive visualization techniques for discovery challenges conventional research processes in the biological and medical fields.
"Usually the visualization of data is something that happens at the end of the research pipeline," said professor Mazalek. "It is the output, rather than something to be used interactively throughout the research process."
Furthermore, the visual models that professor Mazalek is creating are flexible and allow for feedback in order to perfect the algorithms that produce them. "It's really tightening the loop between human and machine."
Funding for this project was provided by the Natural Sciences and Engineering Research Council of Canada, the Canada Foundation for Innovation, and the Ontario Ministry of Research and Innovation.