Surveys
Create surveys and use the statistics tools to monitor current course trends, seek opinions, and assess user satisfaction. Surveys are an excellent way to solicit feedback from participants regarding any aspect of a course.
For example, use surveys as a method of collecting course evaluations, mid-year reviews, or researching people's learning styles and content delivery preferences.
NOTE: If you plan to do a lot of data manipulation with your survey results, you may find that Brightspace’s report design makes this difficult. You may wish to conduct a few tests, to make sure the data design is something you can work with. If it’s not, you may find that a tool such as Google Forms better meets your needs.
Find Surveys in the top menu, under Assessment. If it isn't there, review how to enable course tools.
1. From Assessment > Surveys, click New Survey.
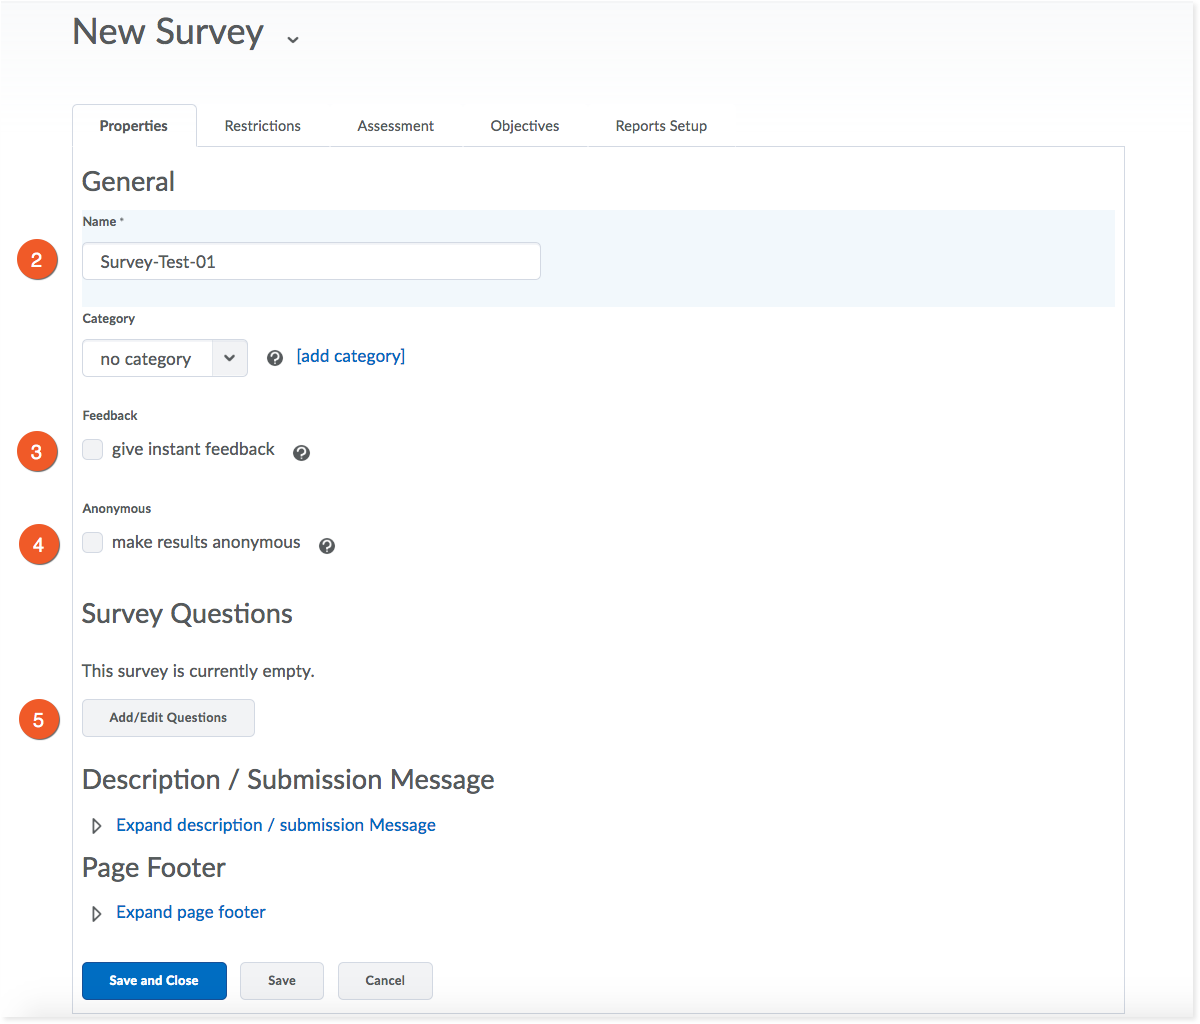
2. On the Properties tab, give your survey a name.
3. You can choose whether or not you want to provide instant feedback to your students once they submit their survey. You have the chance to add feedback when creating survey questions (step 5).
4. Check this box to make all survey submissions anonymous.
Note: Once you click this box, you can't undo the decision to allow anonymous posts for this survey. Anonymous posts are completely anonymous. It will not be possible for you to determine who filled out the survey.
5. Click on Add/Edit Questions to add questions to your survey.
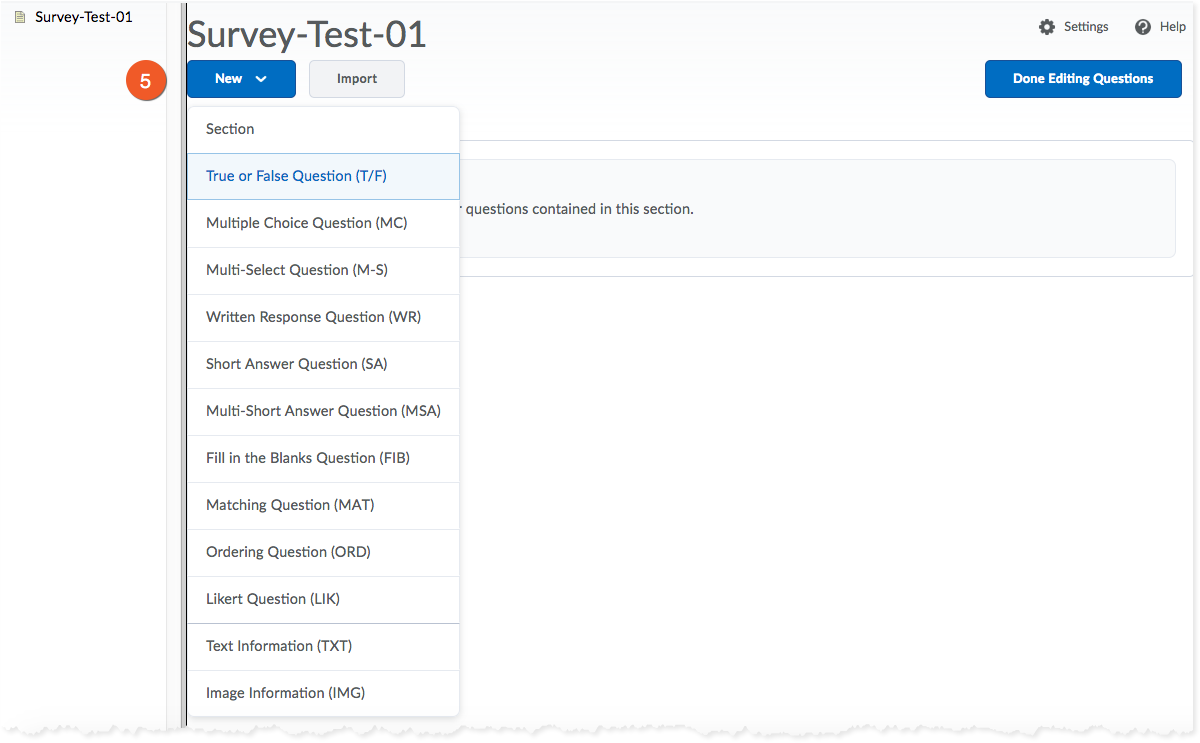
On the next page, you can click on Import > Browse Question Library, to add existing questions from the Question Library.
Or, add and edit new questions by clicking on the New button. You are given a selection of question types, similar to those in the Quizzes feature.
Click on Done Editing Questions when you have finished adding/editing questions, and wish to return to the Survey setup.
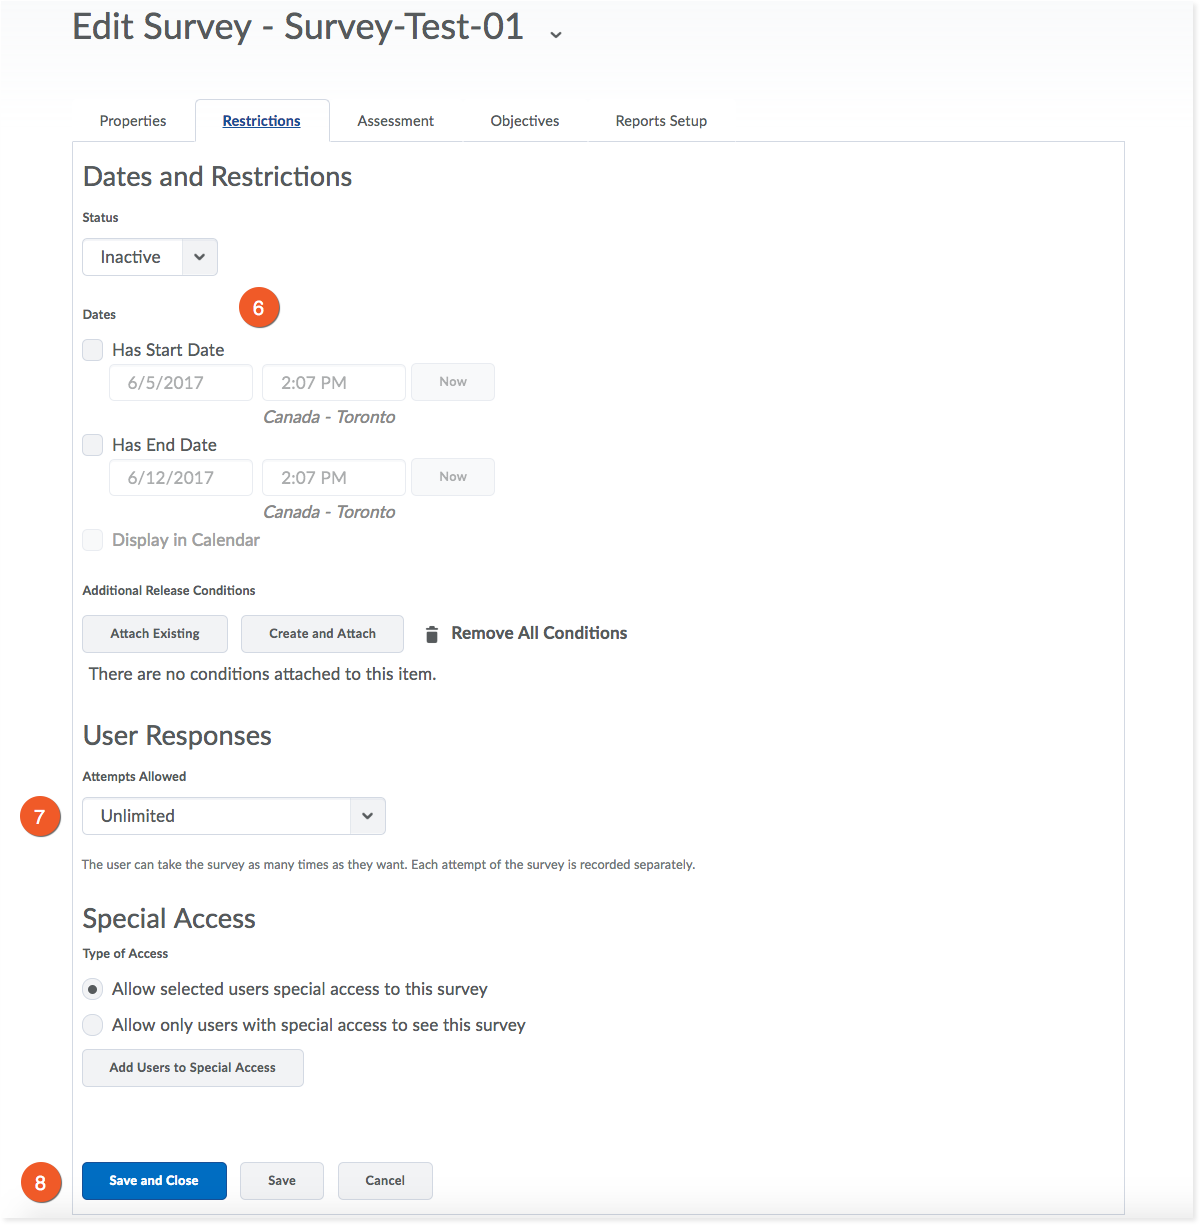
6. Click the Restrictions tab to set the availability of the survey. If you make the survey "active" without setting any dates, it will be available at any time for your students. You can set specific start and end dates for the survey, as well. Keeping the status as "inactive" will hide the survey from students, regardless of the start/end dates.
7. You can control how many attempts the student has responding to the survey.
8. Click Save or Save and Close to save your changes.
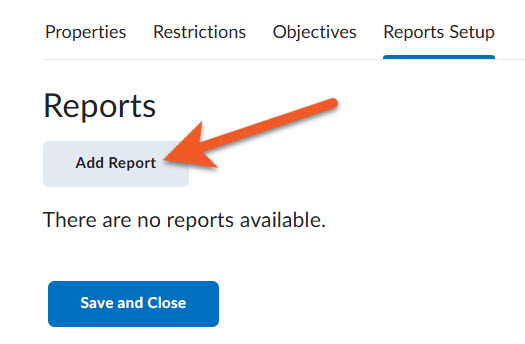
If you neglect to set up at least one report for your survey, you will not be able to view the amalgamated results.
While editing your survey, click on the Reports Setup tab, and click on Add Report.
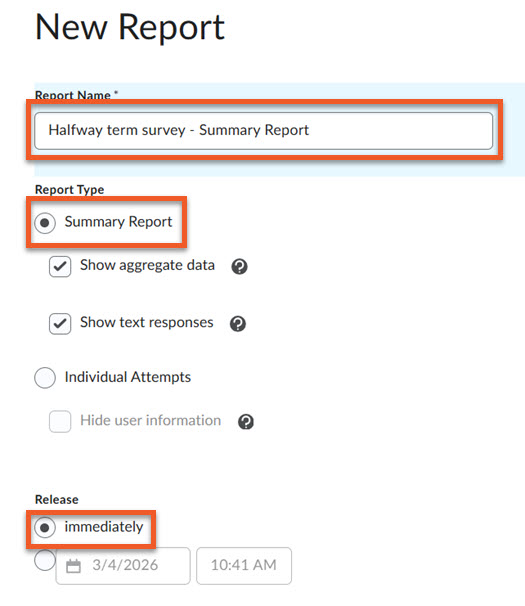
Type in a Report Name. It’s a good idea to provide adequate context in the name, so that if you download the report, it will be easier to find on your computer later.
You will likely find that the Summary Report is the most useful Report Type to select, as it will show you how many users chose each answer option for each question.
You can set the report to Release immediately, or at a specific date in the future, but you will likely want to generate your reports at the time you need them, so “immediately” will probably best meet your needs.
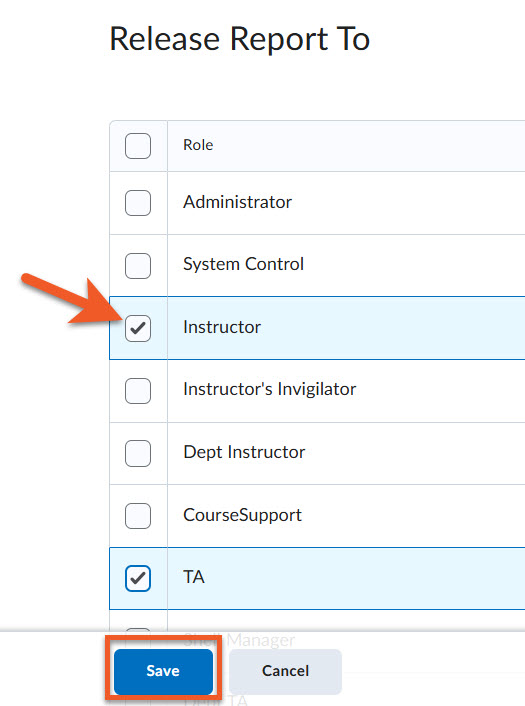
You also need to decide which roles in your shell should have access to the report.
Most of the time, you will only want those with the “Instructor” role in your course shell to have access to this information, but occasionally, you might wish to make reports available to your TA or others.
Remember to click on Save to save your work, and return to the main Reports page for this survey. If you wish, you can repeat this process to generate additional reports.
Click on Save and Close to save all changes to the survey.
After your students have completed the survey, you’ll want to look at the results.
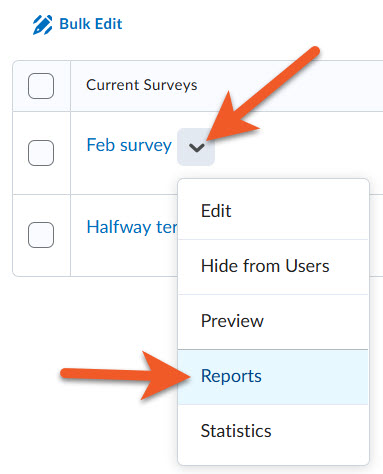
In your course shell, go to Assessment > Surveys. Click on the contextual menu (down arrow) to the right of the survey name, and select Reports.
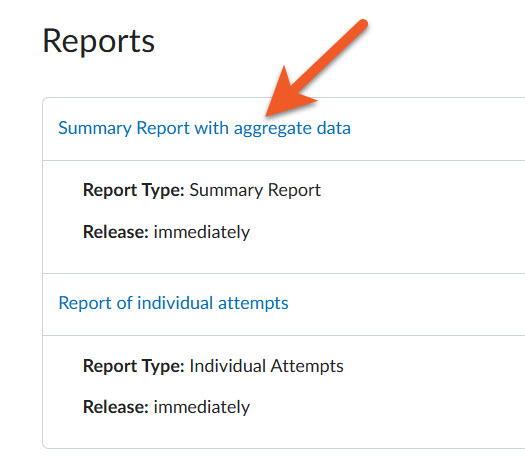
Click on the name of the report you wish to generate or view.
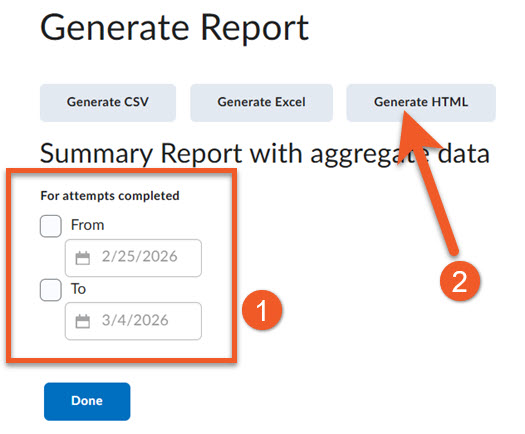
If you only wish to see submissions from a certain date range, select the From or To checkbox, then click on the calendar field to select the date(s).
Our preference (and recommendation), if you just want to easily view the responses to each question, is to just click on Generate HTML. This will display the report in the page in Brightspace, and is a very easy visual layout to understand. Unfortunately, you can’t download this version of the report, but you can print it. Depending on your computer setup, you may be able to “Print to PDF”.
If you want to download a spreadsheet so you can manipulate the data, click on either Generate CSV (preferred) or Generate Excel. However, you may find that these spreadsheets are laid out in a way that doesn’t really match how one might typically use this data. This was a choice that D2L made, and we have no control over this.
Please note: If you choose Generate HTML, the report will load immediately. If you choose either Generate CSV or Generate Excel, the report is generated asynchronously, ‘though this usually takes less than a minute. You see an orange indicator at the top of the page, on the Alerts icon (looks like a bell), when the report is ready for you to download. Click on the alert to download your file.