What a Difference a Year Makes: Population Growth Collapses in the Greater Golden Horseshoe in 2025
By: Frank Clayton, Senior Research Fellow, and Diana Petramala, Senior Economist
March 2, 2026
(PDF file) Print-friendly version available
Highlights
• Tepid population growth in the Greater Golden Horseshoe (GGH) in 2025 follows three years of explosive growth
GGH population growth slowed sharply in 2025 to 40,000 persons from an average of 313,000 per year in the three preceding years. Much lower net international migration was the primary cause.
Most of this slowdown was centred in Toronto and Waterloo. The population fell by 1,000 in the Toronto Census Metropolitan Area (CMA) in 2025, following an average annual increase of 212,000 in the prior three years. The population in the Waterloo CMA grew by just 2,000 persons last year, down from 33,000 persons per year in the three preceding years.
• Population declines in Peel region and city of Toronto dragged down overall growth in the GTA
Population declines in Peel region (-22,000 persons) and the city of Toronto (-9,000) more than offset population growth in Durham (+17,000), York (+11,000) and Halton (+7,000) regions in 2025.
• 2025 saw a marked shift in population growth from the GTA to the Outer Ring of the GGH
Despite the weakness in the Waterloo CMA, the share of GGH growth in 2025 accounted for by Outer Ring (the seven CMAs outside Toronto and Oshawa) climbed from 25% in 2024 to 75% in 2025. Growth was relatively strong in the Barrie and St. Catharines CMAs.
• Ottawa was the fastest-growing CMA in Ontario
Ottawa experienced the most growth of any CMA in Ontario in 2025 (+35,000 persons). Oshawa (+11,000 persons) and St. Catharines (+10,000) were next in terms of absolute growth.
As predicted by CUR last year, the marked decline in net immigration is providing much-needed respite for housing markets in the GGH. Lower demand is being reflected in rising unsold resale home inventories, softening rental market, and softening market prices and rents.
Municipalities should capitalize on this demand lull to increase the supply of shovel-ready sites to support a range of housing products in anticipation of the forthcoming market upturn and to enhance builder competition in both built-up and greenfield areas. All levels of government should endeavour to reduce the onerous costs they impose on new housing development to enhance housing affordability.
Background
Statistics Canada recently released its annual population estimates for subprovincial areas of Ontario as of July 1, 2025. Estimates for census metropolitan areas (CMAs) and census divisions (CDs) within the Greater Golden Horseshoe (GGH) are presented here.[1] The population estimates for the post-2021 Census of Canada are subject to revision following the 2026 Census.
Census Metropolitan Areas (CMAs)
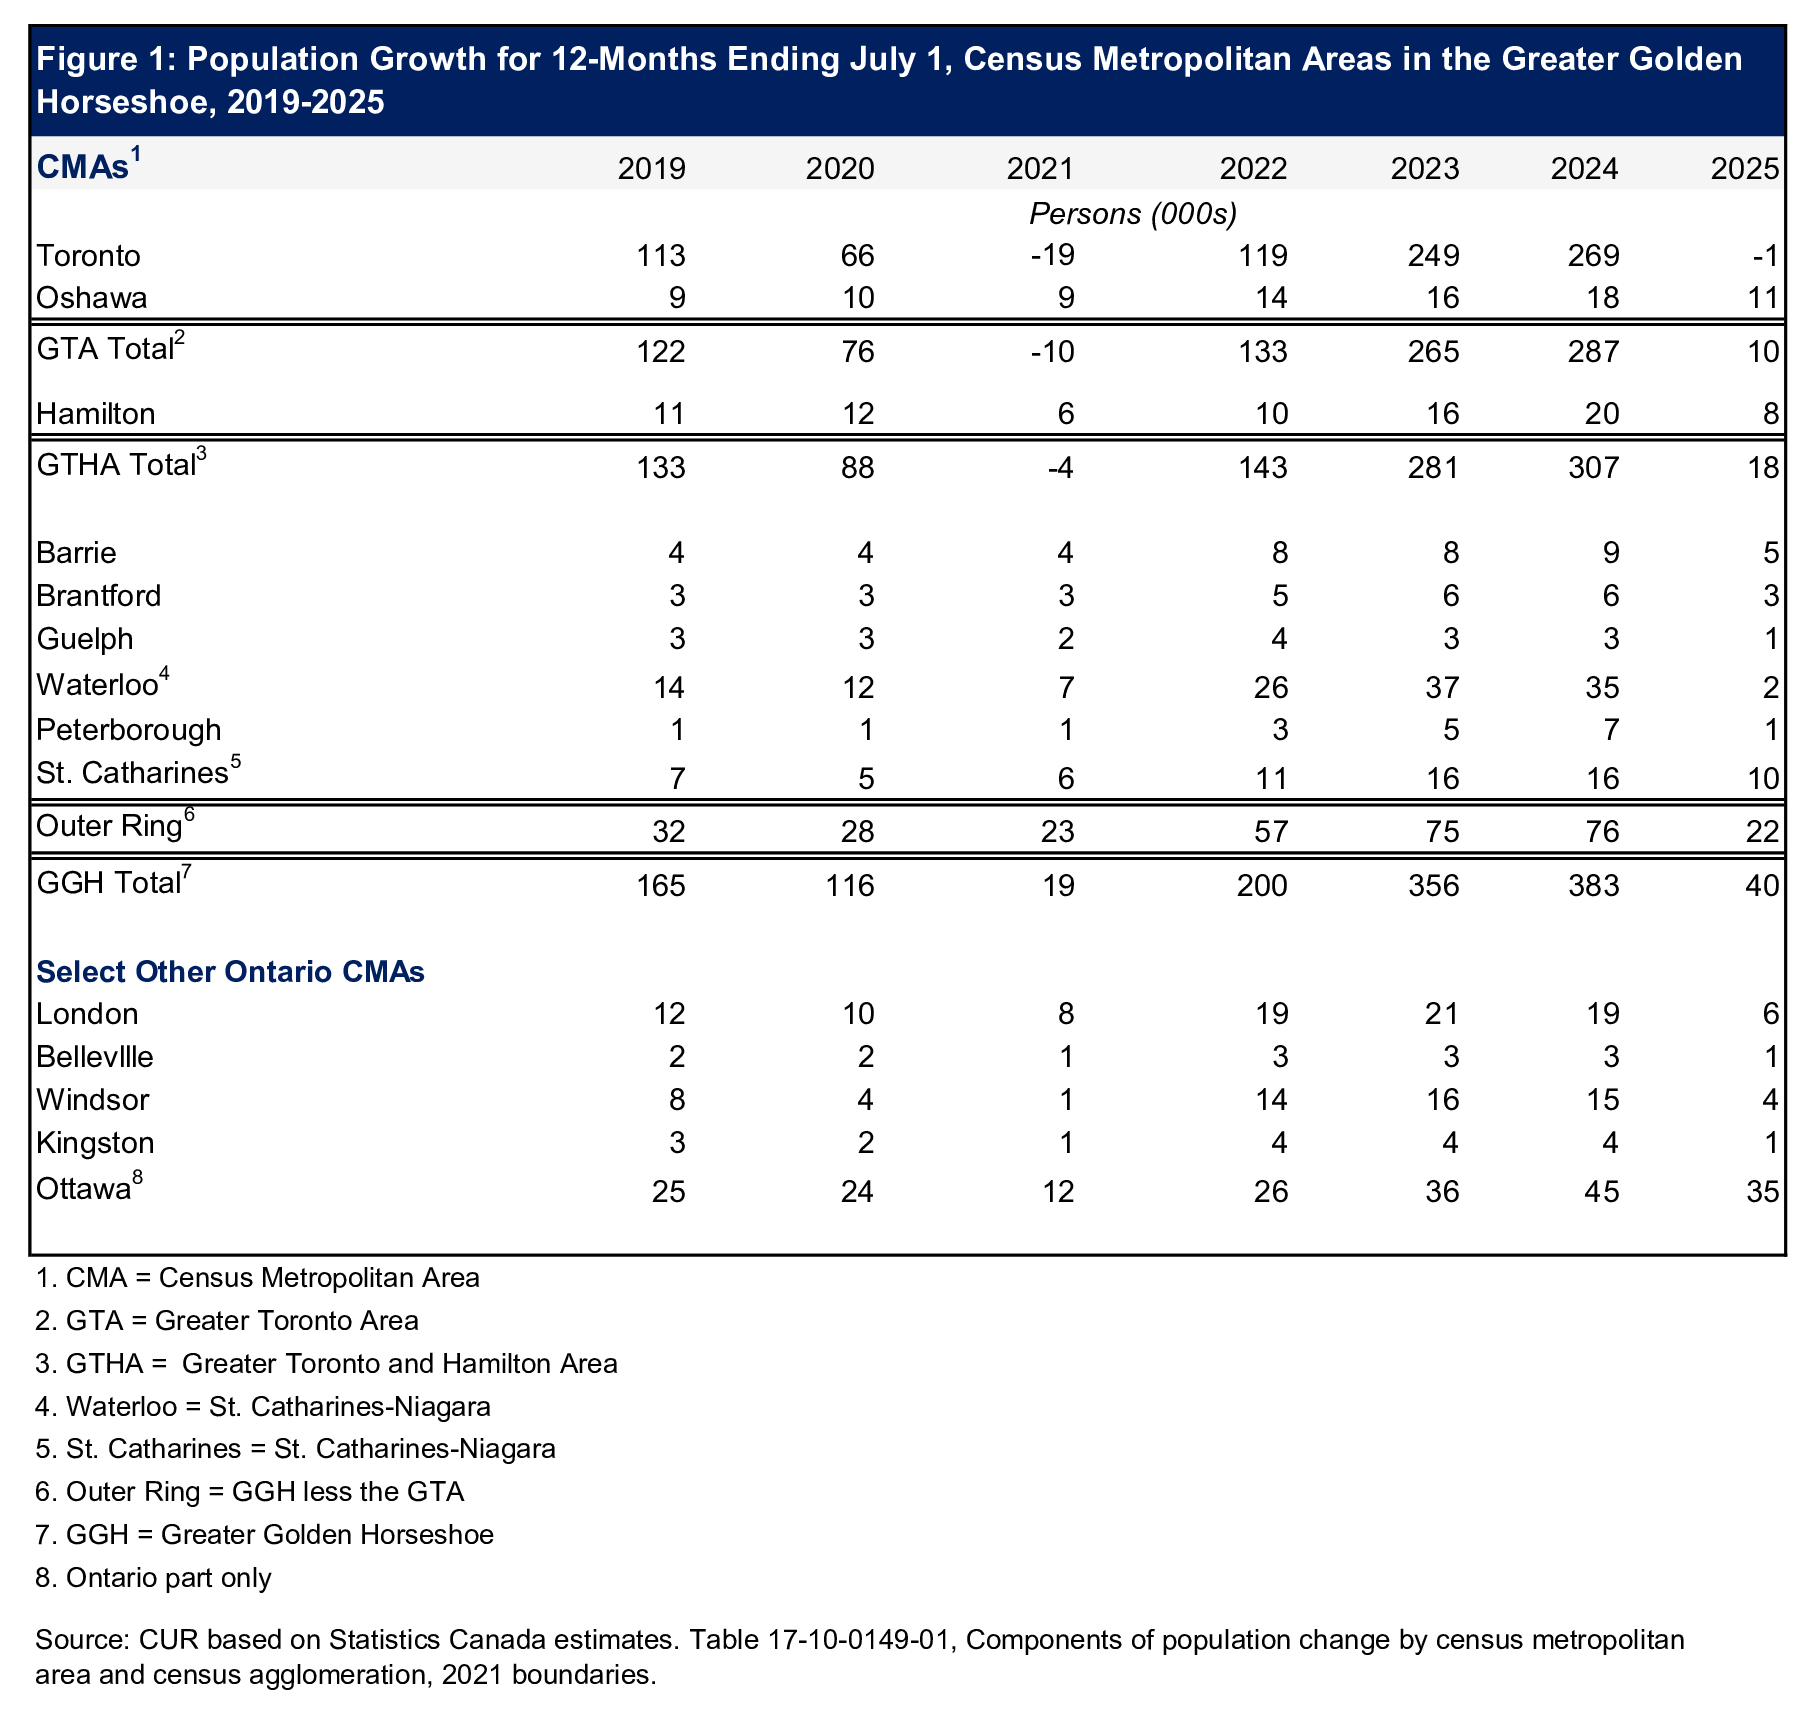
Figure 1 presents population growth for the 12 months ending July 1 from 2019 to 2025 for the nine CMAs within the GGH and for four other CMAs within Ontario.
Tepid population growth in the GGH following three years of explosive growth
GGH growth fell precipitously to 40,000 persons in the 12 months ending July 1, 2025, from a stunning 383,000 persons a year earlier. While this population increase exceeded the pandemic-era growth (+19,000 in 2021), it lagged all other years since 2019 by a wide margin. Sharply lower net immigration was the primary reason for the collapse in 2025.
No growth in the GGH's economic heartland, the Toronto CMA
The metropolitan area anchored by the city of Toronto experienced a surprising population decline in 2025 (-1,000 persons), the only CMA to do so. Growth in Oshawa led to modest overall population growth in the Greater Toronto Area (GTA) (+10,000).
The Waterloo CMA[2] recorded a massive slowing in population growth
Population growth in the Waterloo CMA fell sharply to 2,000 persons in 2025 from 35,000 the previous year. Growth was even lower than at the pandemic's nadir.
Marked shift in population growth from the GTA to the Outer Ring CMAs
Despite the weakness in the Waterloo CMA in 2025, the share of GGH growth in 2025 accounted for by the Outer Ring (the seven CMAs outside Toronto and Oshawa) climbed from 25% in 2024 to 75% in 2025. Outer Ring growth was relatively strong in the Barrie and St. Catharines CMAs.[3]
Ottawa was the fastest-growing CMA in Ontario
Ottawa experienced the most growth of any CMA in Ontario in 2025 (+35,000 persons).[4] Oshawa (+11,000 persons) and St. Catharines (+10,000) were next in terms of absolute growth.
Census Divisions (Municipalities)
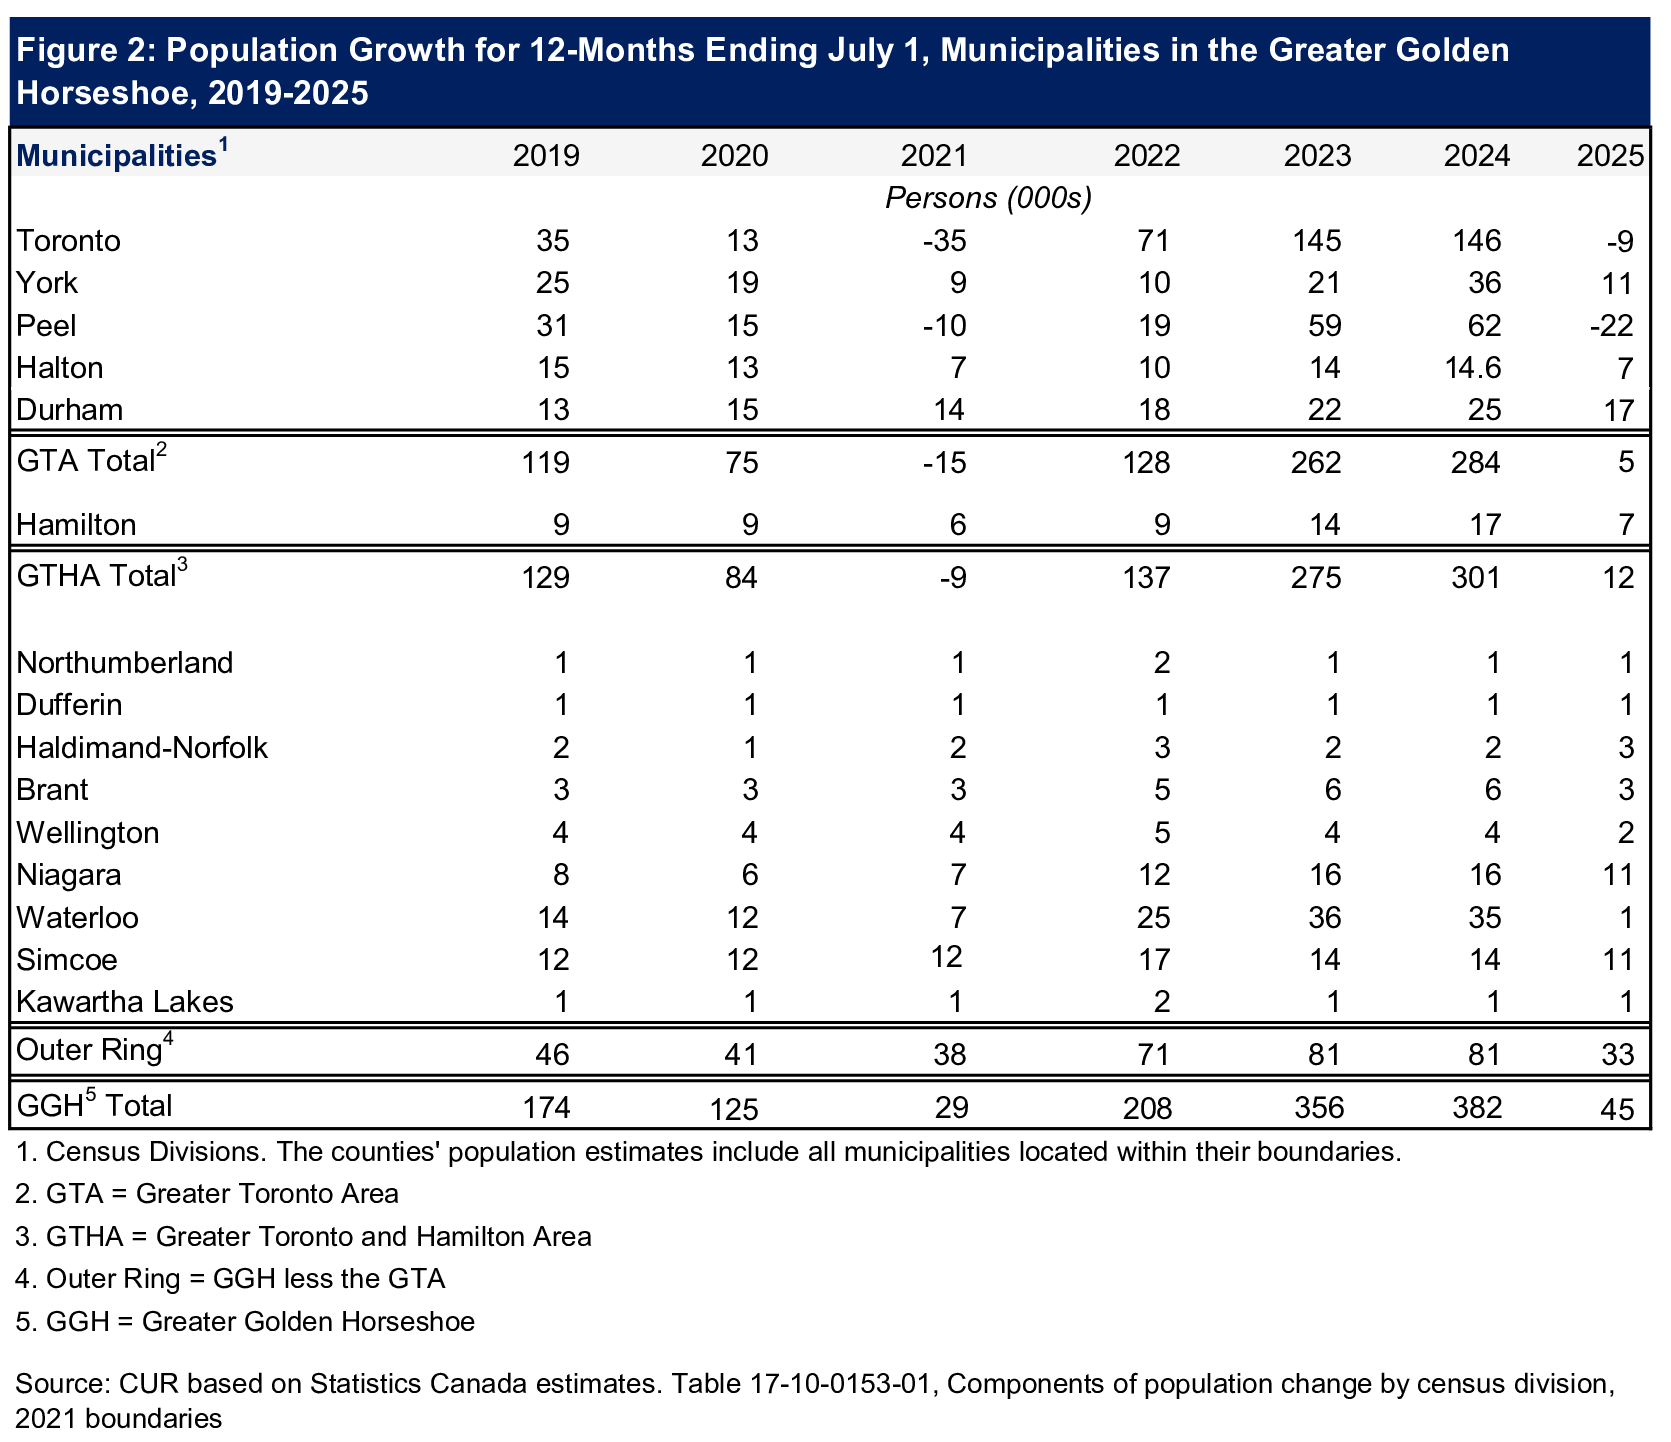
Figure 2 presents population growth for the 12 months ending July 1 from 2019 to 2025 for the major GGH municipalities as measured by census division boundaries (see footnote 1).
Lack of GTA growth due to declines in Peel region and city of Toronto
Population declines in the Peel region (-22,000 persons) and the city of Toronto (-9,000) more than offset population growth in the Durham, York, and Halton regions.
Growth in other municipalities near pre-immigration-boom levels
Simcoe county and the Niagara region (each at +11,000 persons) and the city of Hamilton (+7,000) had the most absolute population growth in 2025 among GGH municipalities outside the GTA. Their growth was similar to that recorded in 2019, before the pandemic. This pattern also held for most non-GTA municipalities.
Implications for Governments
As predicted by CUR last year, the marked decline in net immigration is providing much-needed respite for housing markets in the GGH, both in built-up and greenfield areas.[5] Lower demand is being reflected in rising unsold resale home inventories, softening rental market, and softening market prices and rents.
Municipalities should make the most of this demand lull to increase the supply of shovel-ready sites for a range of housing products, in anticipation of the coming demand upturn, and to enhance builder competition. All levels of government should endeavour to reduce the onerous costs they impose on new housing development to enhance housing affordability.
End Notes
[1] CMAs are commutersheds based on where most of the population in an urban region lives and works. As such, they represent housing market areas that individual municipalities typically do not. Census divisions include single-tier municipalities (cities of Toronto and Hamilton), regional municipalities (e.g., Peel, Niagara, and Halton), and counties, including their separated municipalities (the Simcoe County CD incorporates the populations of Barrie and Orillia, for example). The blog refers to CDs as municipalities.
[2] The official name is the Kitchener-Cambridge-Waterloo CMA.
[3] Officially, the St. Catharines-Niagara CMA.
[4] Most of the population growth in the Ottawa-Gatineau CMA is on the Ottawa side of the Ottawa River.
[5] The 2024 population estimates were reviewed in: Frank Clayton and John Clinkard. “Spectacular Population Growth Continued in the City of Toronto and Peel Region in 2024.” CUR. March 5, 2025.
References
Clayton, Frank and Clinkard, John (2025). “Spectacular Population Growth Continued in the City of Toronto and Peel Region in 2024.” CUR. March 5, 2025. [Online]. Available: https://www.torontomu.ca/centre-urban-research-land-development/blog/blogentry96-spectacular-population-growth-continued-in-toronto-peel-region/.
Statistics Canada (2026). Table 17-10-0149-01, Components of population change by census metropolitan area and census agglomeration, 2021 boundaries. [Online]. Available: https://www150.statcan.gc.ca/t1/tbl1/en/tv.action?pid=1710014901 (external link) .
Statistics Canada (2026). Table 17-10-0153-01, Components of population change by census division, 2021 boundaries. [Online]. Available: https://www150.statcan.gc.ca/t1/tbl1/en/tv.action?pid=1710015301 (external link) .