Canada’s Transit Trips Recovering at Varying Rates – GO Outpaces TTC in 2024 and Early 2025
By: Frank Clayton, Senior Research Fellow, and Diana Petramala, with research assistance from Anas Ahmad
June 17, 2025
(PDF file) Print-friendly version available
In this blog, we assess annual trends in the number of transit trips taken across the country and explore how metropolitan areas and transit agencies have performed in recent years. The analysis looks at annual transit ridership data for 2024 and the first three months of 2025, as released by Statistics Canada (StatCan), compared to 2023 and relative pre-pandemic levels (post-2019).
Key findings include:
- The number of rides taken on the combined urban transit systems in 2024 in Canada were still 16% below their pre-pandemic peak in 2019;
- Transit agencies in Quebec and Ontario experienced the slowest recovery, whereas the Atlantic region has had the fastest – being the only region to surpass its pre-pandemic peak in 2024;
- Narrowing in on metropolitan Toronto, the number of transit trips taken on GO Transit (GO) rose 23% in 2024, while Toronto Transit Commission (TTC) ridership was only up 3%; and
- The recovery in national transit passenger trips has stalled, with the number of trips taken in the first quarter of this year up just 1.0% year-to-date. There is a sharp contrast in the performance between the TTC (-0.9%) and Metrolinx (+12.0%).
Background
Urban analysts require data to understand how individuals move within urban environments, encompassing various transportation modes such as cars, public transit, walking and cycling. There is no national comprehensive database for urban trips, excluding the Census of Canada data on modes of work trips, available every five years.
Since January 2017, StatCan has released passenger counts as part of its Monthly Passenger Bus and Urban Transit Survey. The survey collects total operating revenues and passenger trip data from urban and intercity transit companies across Canada, representing at least 75% of urban transit and intercity bus revenues. Most trips are urban transit trips.
This database was not very useful since it was only released for regions (combinations of provinces) comprised of: Quebec and Ontario; the Prairies, British Columbia, and the territories; and the Atlantic provinces. This aggregation made it impossible to discern specific transit patterns within a province, let alone individual urban regions.
The database significantly improved in February 2024 when StatCan began releasing monthly data for select urban transit agencies with comparable data for 2023. This development provided more granular insights into transit ridership and trends within different urban areas. At the time of writing, passenger trip data was available for the full years of 2024 and 2023 and the first quarter of 2025.
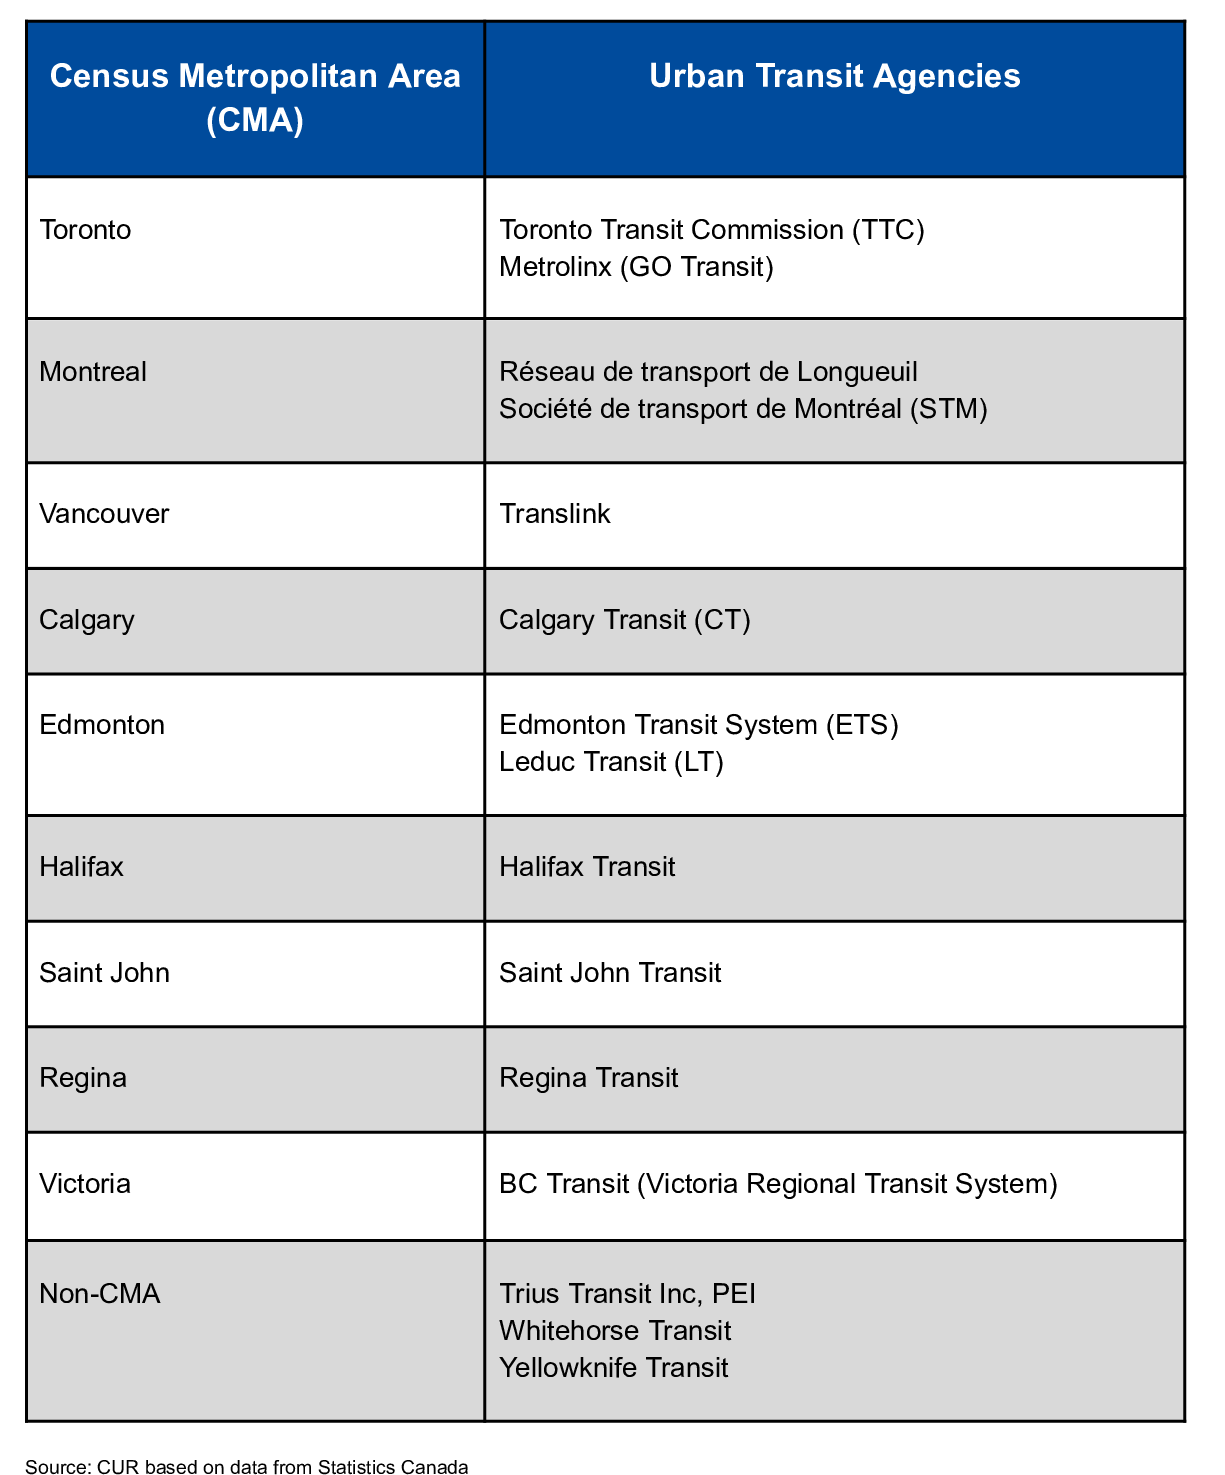
Figure 1 lists the transit agencies surveyed monthly by StatCan, organized by census metropolitan area (CMA) where appropriate. CMAs represent the commutersheds where most urban residents live and work.
Urban Transit Ridership by Major Region, 2019-2024
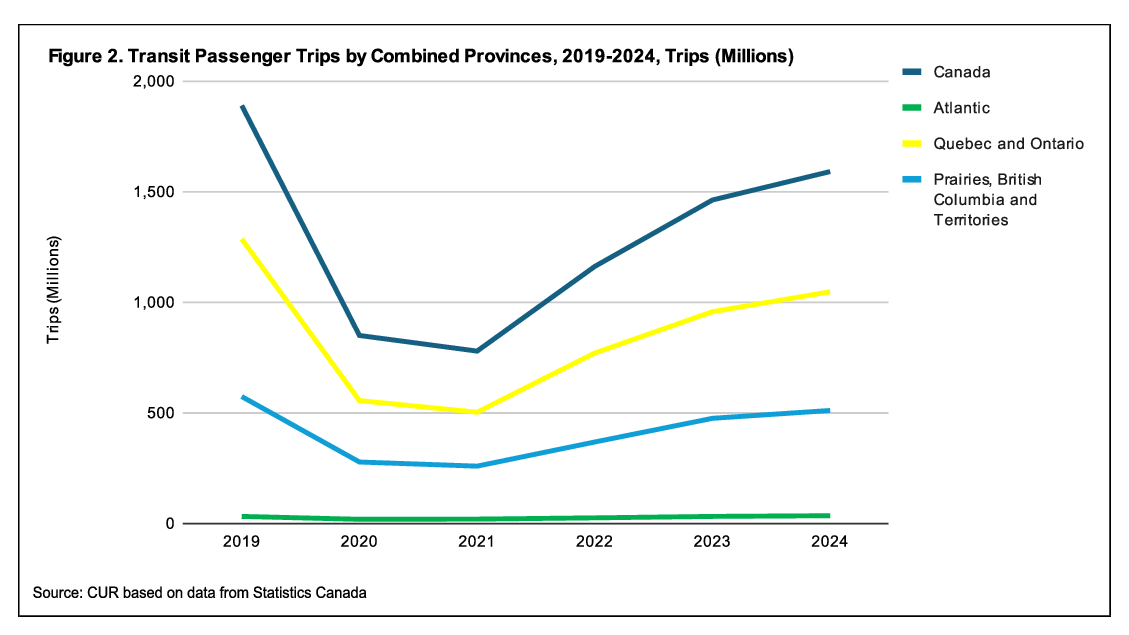
Figure 2 shows public transit usage trends across various Canadian regions for a five-year period, comparing passenger trips (in millions) in the Atlantic provinces, the Prairies/British Columbia, and Quebec/Ontario.
Highlights include:
- In 2024, total ridership in Canada reached 1.59 billion trips, an 8.8% increase from 2023. However, transit trips were still 16% below their pre-pandemic (2019) peak levels;
- Over 66% of transit rides occurred in Quebec and Ontario, combined;
- Ridership in Quebec and Ontario increased to 1.05 billion trips in 2024, up 9.4% year-over-year. However, ridership in 2024 was only at 81% of its pre-pandemic level, representing the slowest post-COVID recovery of the regions studied here;
- The Prairies, British Columbia and Territories saw a ridership increase of 7.5%, reaching 509.9 million trips in 2024. Ridership in these regions combined is at 89% of its 2019 peak level; and
- While the Atlantic region accounts for a very small number of transit trips in Canada, this region has experienced the fastest post-pandemic recovery. Transit ridership in the region increased by 10.4%, in 2024 to 34 million trips. Urban transit trips in the Atlantic region rose above their pre-pandemic peaks in 2024.
Passenger Trips by Census Metropolitan Area (CMA), 2023 and 2024
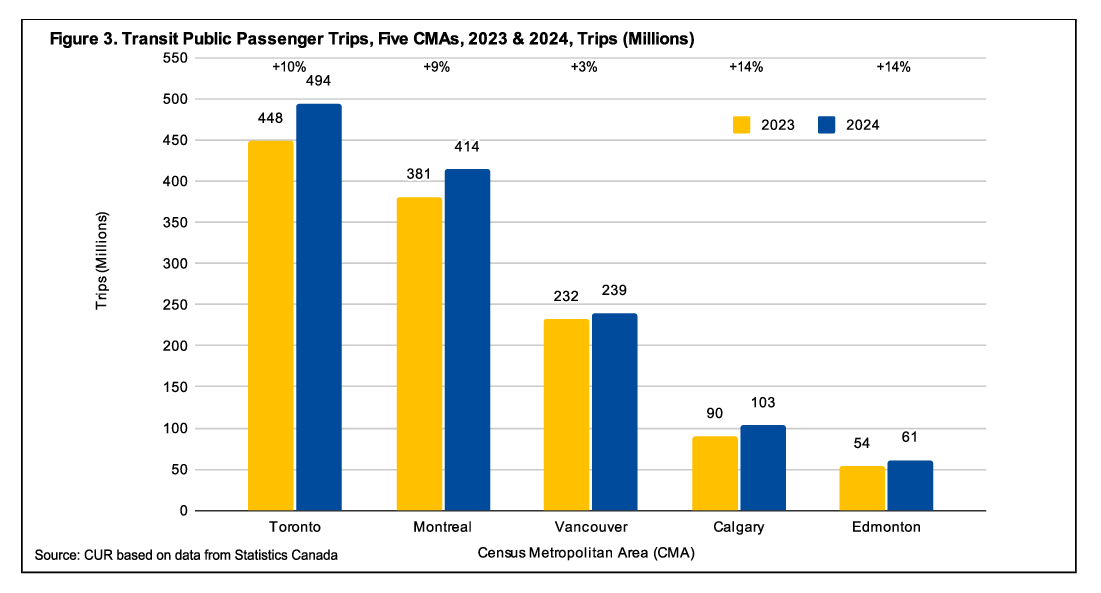
Figure 3 shows transit passenger trips during 2023 and 2024 in five of the nine CMAs covered by the urban transit agencies in the StatCan survey. Halifax and Saint John are excluded due to their small numbers.
Ridership in the largest Canadian urban transit agencies (Toronto, Montreal and Vancouver) continues to recover at different rates.
Highlights include:
- Calgary and Edmonton experienced the fastest growth in transit usage among major Canadian metropolitan areas, both up 14% in 2024. These findings are consistent with their rapid pace of population growth;
- Toronto’s transit ridership (TTC and GO Transit) rose by 10.1% in 2024, reaching 493.9 million trips;
- Ridership rose by 8.7% year-over-year in Montreal, with a total of 413.7 million trips in 2024;
- As we noted in an earlier blog post[1], Montreal has very similar ridership to Toronto, despite Toronto having a significantly larger population; and
- Ridership on Vancouver’s TransLink rose by 3.2%, reflecting a slower pace of recovery compared to its eastern counterparts.
Transit Passenger Trips in the Toronto CMA: TTC and GO
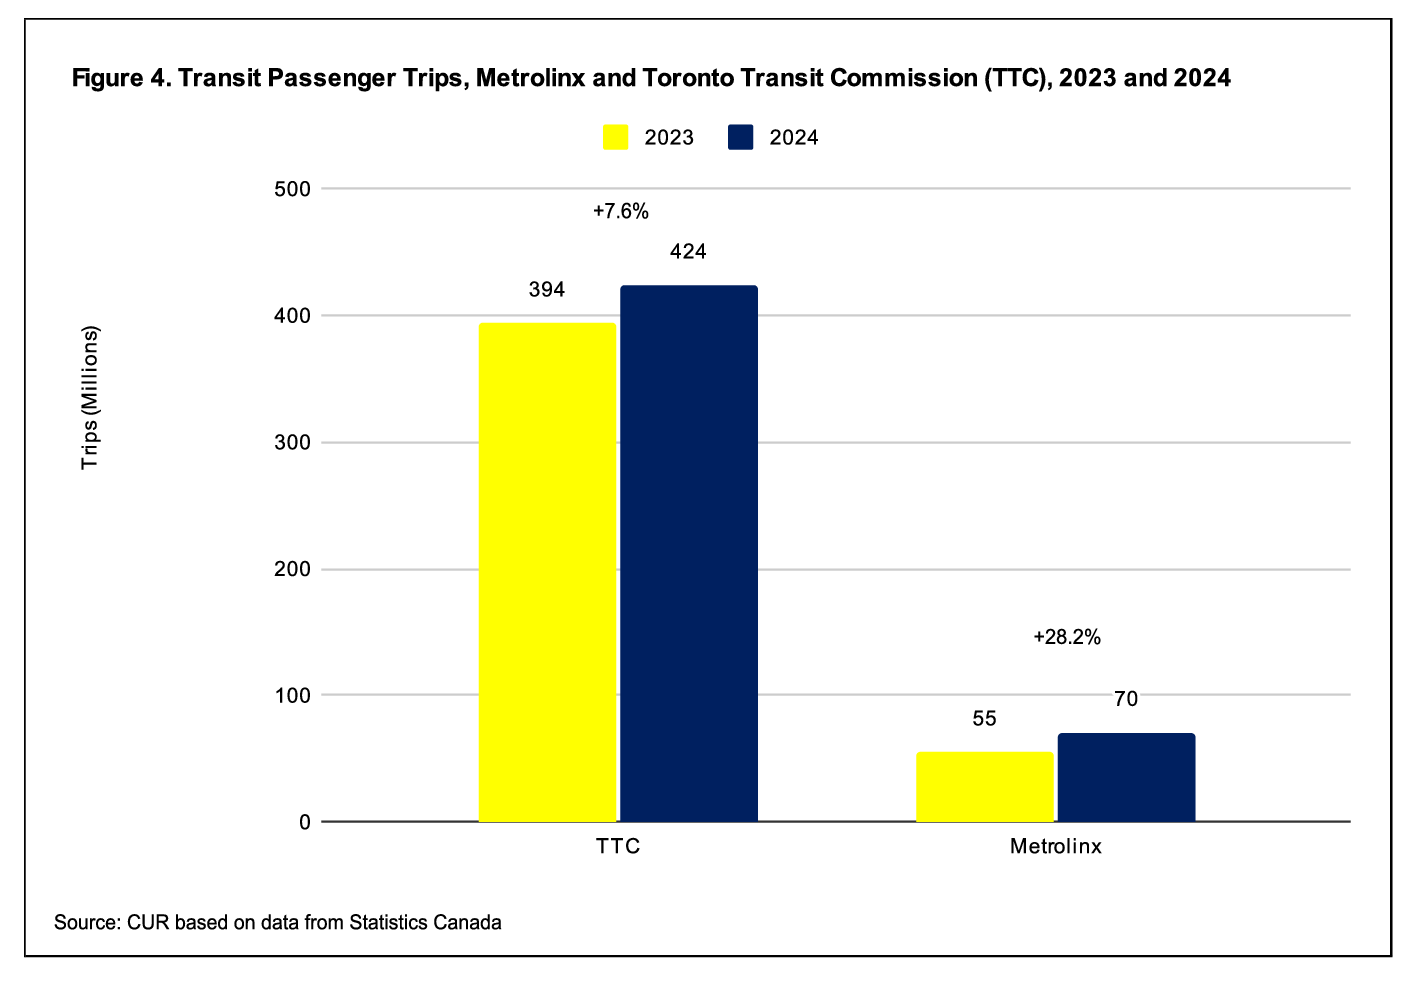
Figure 4 shows the annual transit passenger trips in the Toronto CMA in 2023 and 2024, split between the TTC and GO Transit.
Highlights include:
- The number of trips taken on the GO (including UP Express) rose 28% in 2024, far outstripping growth in TTC ridership of just 8%; and
- The number of recorded transit trips taken on the TTC in 2024 (424 million) still far surpassed those taken on the GO (70 million) in 2024.
Recovery in Transit Passenger Trips Stalls in First Three Months of 2025
Figure 5 shows data on transit passenger trips for the first three months of 2025 for the ten largest transit agencies in Canada compared to ridership during the same period in 2024. The data shows that the year started off on a soft footing.
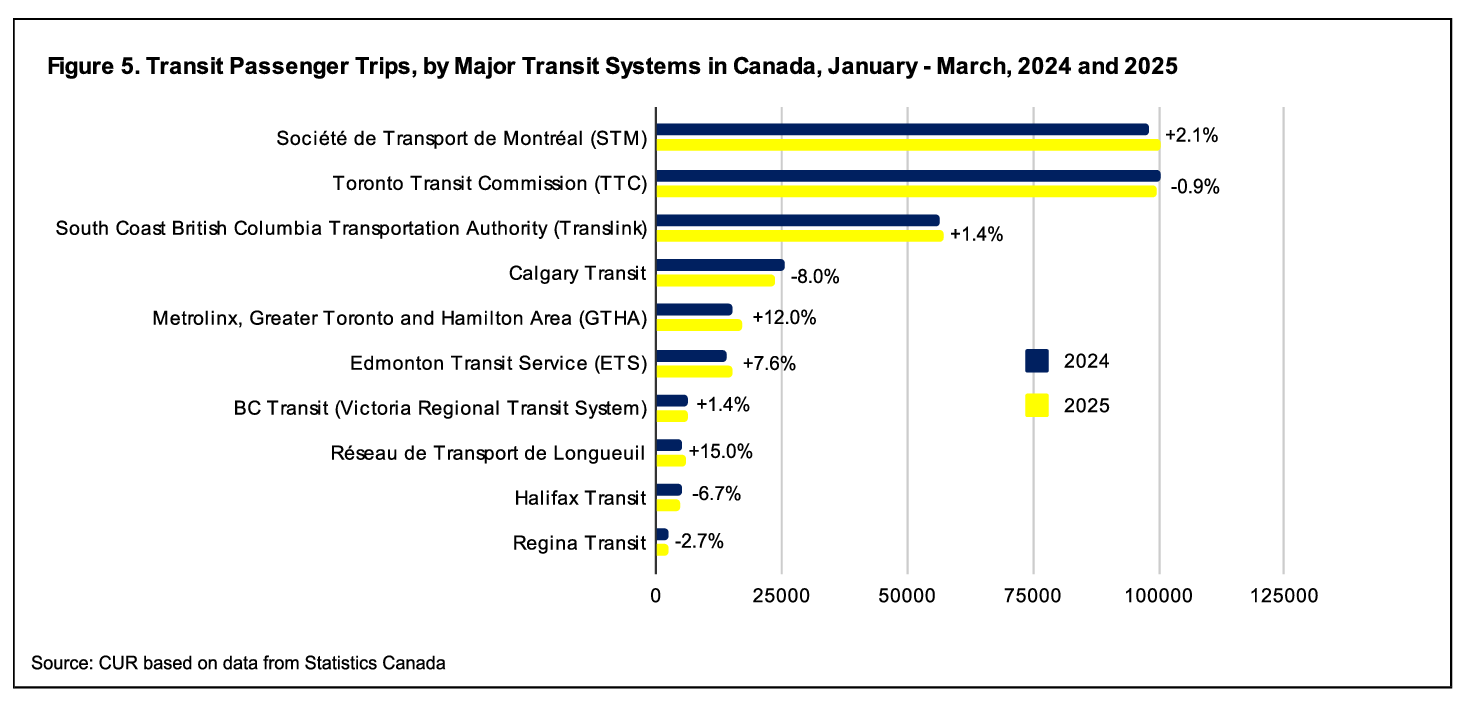
Highlights include:
- Overall, 334 million transit passenger trips were taken between January and March of this year, up just 1.0% from the same period a year ago. This may be due to weather effects, as this year was colder and snowier than last year in many parts of the country;
- Four transit systems experienced a decline in passenger trips during the first three months of the year, relative to a year ago, including those in Toronto, Halifax, Regina and Calgary;
- The fastest growing transit system in 2025 so far is the Réseau de Transport de Longueuil in Montreal (+15.0%); and
- Ridership on the GO Transit systems was up 12% year-over-year in the first three months, while ridership was down 0.9% year-over-year on the TTC.
Conclusion
In this blog, we assessed annual trends in the number of transit trips across the country and explored how cities and transit agencies have performed in recent years.
Key findings include:
- The number of rides taken on urban transit agencies in 2024 in Canada were still 16% below their pre-pandemic peak in 2019;
- Transit agencies in Quebec and Ontario experienced the slowest recovery whereas the Atlantic region has had the fastest – being the only region to surpass its pre-pandemic peak in 2024;
- Narrowing in on metropolitan Toronto, the number of transit trips taken on GO Transit (GO) rose 23% in 2024, while Toronto Transit Commission (TTC) ridership was only up 3%; and
- The recovery in national transit passenger trips has stalled, with the number of trips taken in the first quarter of this year up just 1.0% year-to-date. There is a sharp contrast in the performance between the TTC (-0.9%) and Metrolinx (+12.0%).
End Notes
[1] Frank Clayton and Yagnic Patel. “Percent Increase in GO Passenger Trips Three Times the TTC in the First Quarter, 2024 According to Statistics Canada”, June 2024.
References
Clayton, Frank and Yagnic Patel. “Percent Increase in GO Passenger Trips Three Times the TTC in the First Quarter, 2024 According to Statistics Canada”, June 2024. Centre for Urban Research and Land Development. [Online]. Available: https://www.torontomu.ca/centre-urban-research-land-development/blog/blogentry7311111111111/.
Statistics Canada. Table 23-10-0307-01 Passenger bus and urban transit statistics, by Urban transit agency (x 1,000) (external link) .
Statistics Canada. Table 23-10-0251-01 Passenger bus and urban transit statistics, by the North American Industry Classification System (NAICS) (x 1,000,000) (external link) .