When Household Size Doesn’t Fall: Toronto’s Housing Supply Shortfall Explained
By: Diana Petramala
January 22, 2026
(PDF file) Print-friendly version available
Not everyone is on board with the idea that we have built too few homes in the Toronto CMA (Toronto) – the geographic region covering the City of Toronto and the five surrounding suburbs. Some argue that average household size (the number of persons living in a home) has not gone up. If too few homes were built in Toronto, wouldn’t more and more people be crammed into fewer houses? Would this not drive average household size up?
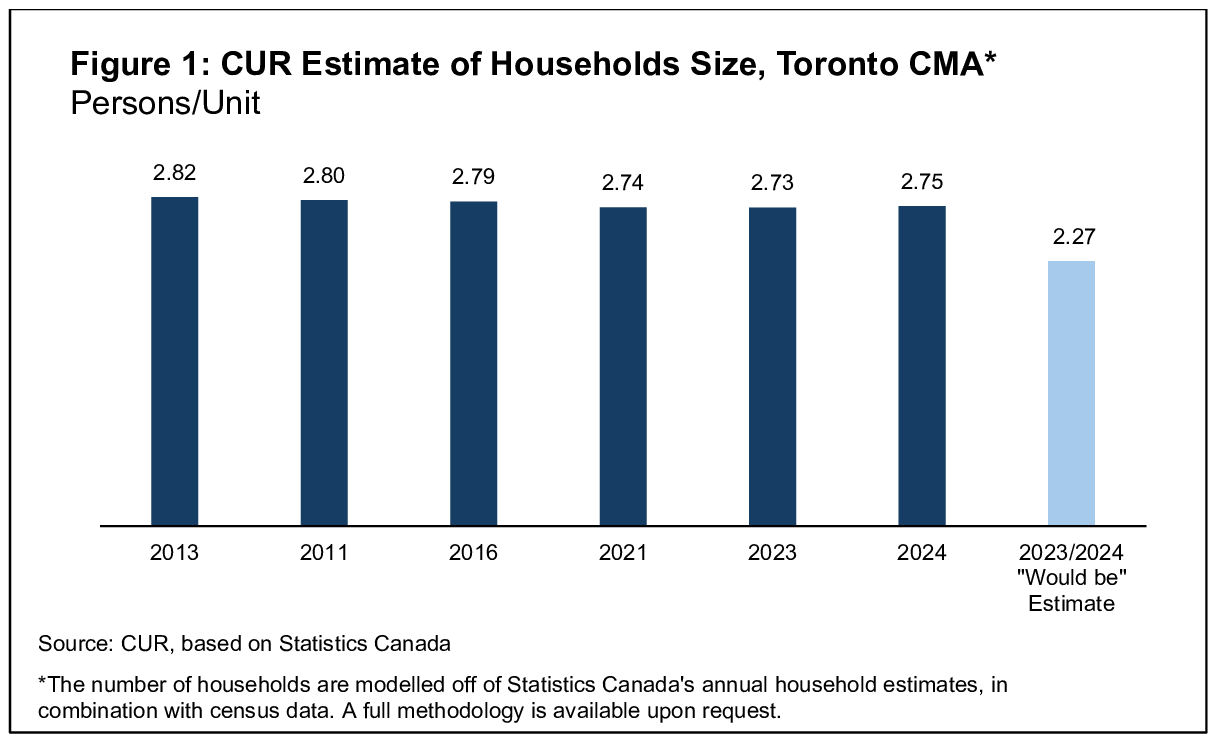
CUR’s household size model confirms the surprising result: between 2013 and 2024, average household size in the region stayed flat (see Figure 1). But there is a twist: the population is ageing, and more young people are single[1]. These trends should have reduced household size.
That makes the flat result even more striking. Household size has not fallen in the way that we would have expected. Given the age and structure of families, household size should have fallen to 2.27 by 2024, but instead it stood at 2.75.
CUR creates a model to estimate more up-to-date estimates of the number of households in Toronto
Traditionally, average household‑size figures come only from the Statistics Canada Census, which is released every five years (most recently in 2021). But Census counts have clear limitations: for example, the 2021 Census has an estimated net under‑coverage rate for the population of about 3 % nationally and around 3.95 % in Ontario alone.
To get a more up‑to‑date (2024) view of household size, our team at the Centre for Urban Research and Land Development built a model combining:
- annual population estimates by age for Ontario and Toronto (to July 2024), adjusted for census under‑counts;
- the number of tax filers and dependants by family type and living arrangement in Toronto for 2023 (including people not in a Census family, living alone, with roommates or relatives);
- an annual estimate of households in Ontario (including under‑count adjustments) as at July 2024; and
- new home‑completion data.
As shown in Figure 1, CUR’s model estimates that average household size actually ticked up slightly between 2023 and 2024. This is a surprising result given Toronto’s older population and growing share of single-persons. Given these demographic trends we would have expected household size to fall.
CUR estimates of Household Growth in Toronto
Figure 2 shows CUR’s estimate of households in Toronto between 2011 and 2024, relative to Ontario (actual data).
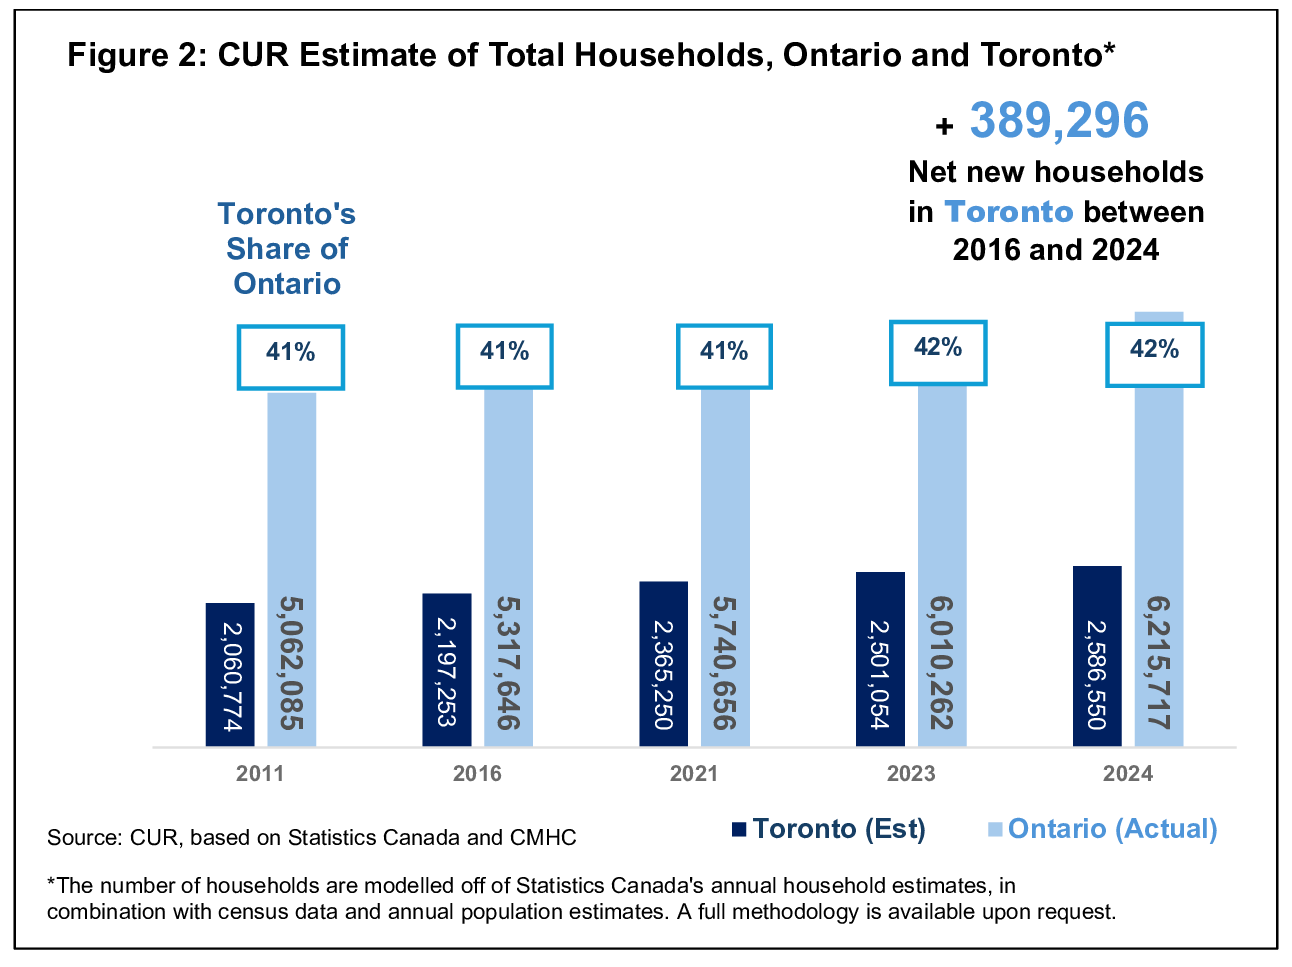
Total households are expected to have reached almost 2.6 million in 2024, up by more than 389,000 from 2016.
Construction vs. Household Creation
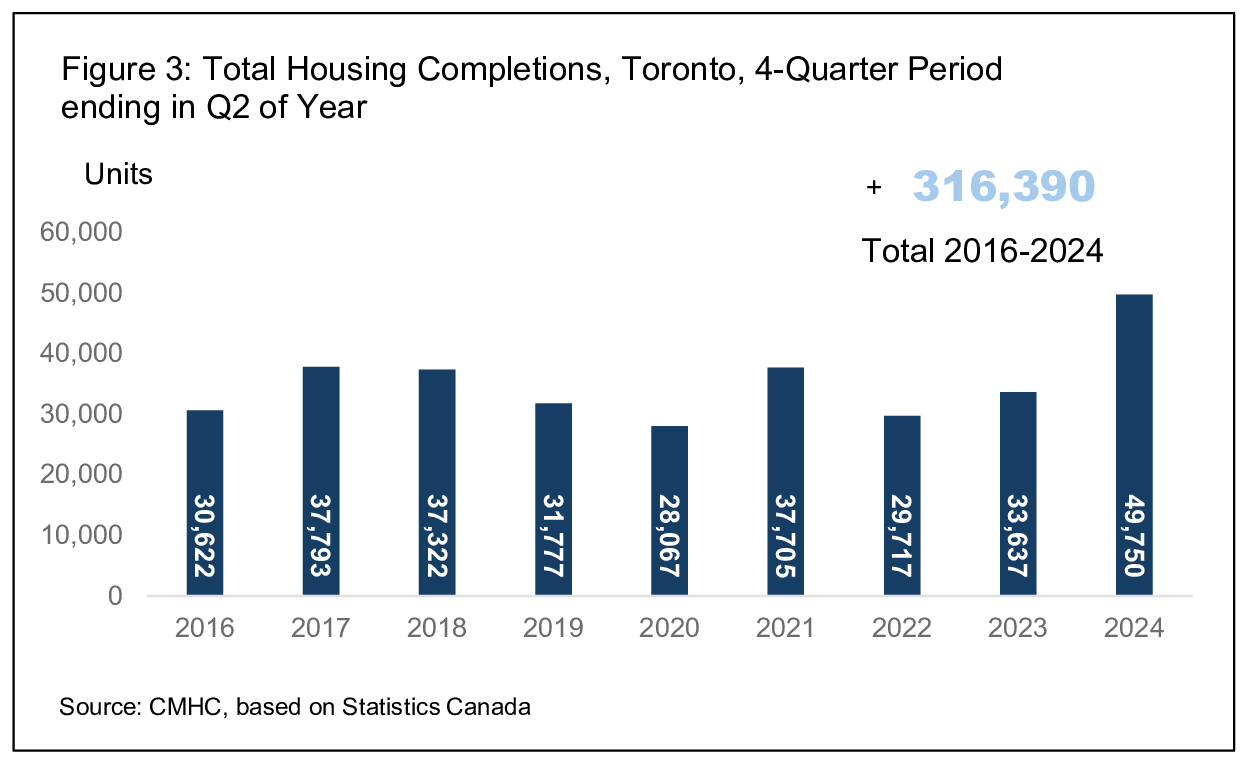
On the flip side, Figure 3 shows the number of new homes constructed (completions) over the same period. As you can see, there were fewer homes built than households created.
So how is this possible?
Here are a few possible explanations for this gap:
- Housing completions are not a perfect measure of housing supply. Some units are likely under-counted, especially secondary suites and accessory dwellings (which might not be captured in the standard completion statistics).
- Some of the extra demand is being met through units that were previously vacant. For example, the new Vacant Home Tax in Toronto may have encouraged owners to either rent or sell units that once sat idle.
- New regulations for short-term rentals means some units previously used for tourism are being converted back into the long-term rental market. For instance, Toronto’s rules now restrict short-term rentals to a host’s principal residence only, preventing many investment properties from operating as full-time short-term rentals.
The changing nature of households in Toronto: Less Children, more single households
So, the question becomes: given our age profile and family‑types, what should the average household size look like?
If supply had kept pace with family structure, we’d expect household size to trend further downward. Yet it isn’t.
There are two major trends in family structures that should be putting downward pressure on household size:
- Couples are having fewer children. In fact, the number of couples without children is growing more rapidly than the number of couples with children. This shift may reflect both an ageing population (which increases the share of empty-nester couples) and a growing choice or trend among couples to remain child-free; and
- Single persons are the fastest growing family type in Toronto.
For clarity, Statistics Canada defines a census family as:
“a married couple and the children, if any, of either and/or both spouses; a couple living common law and the children, if any, of either and/or both partners; or a parent of any marital status in a one-parent family with at least one child living in the same dwelling and that child or those children.”
A single person is a person not living in a census family, that is not living with a child, spouse or partner. Note, two or more persons not in a census family can live together as roommates.
Figure 4 highlights how families and persons not in families have changed over the last two decades in Toronto.
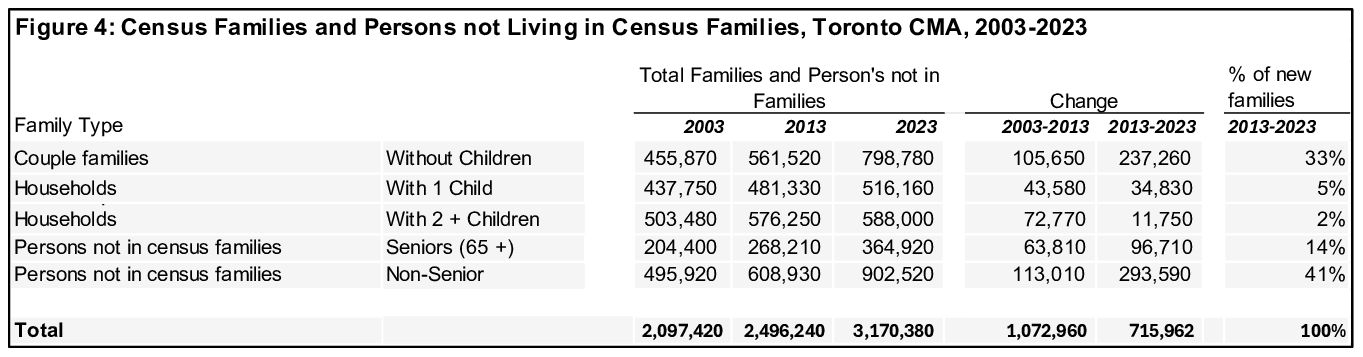
The table shows a sharp deceleration in the growth rate of census families with children (+5%), contrasted with a doubling in the number of coupled-families no children (28% of growth) and single-persons not in a census family (+46% of growth). The growth in coupled families with no children could be due to senior couples becoming empty nesters.
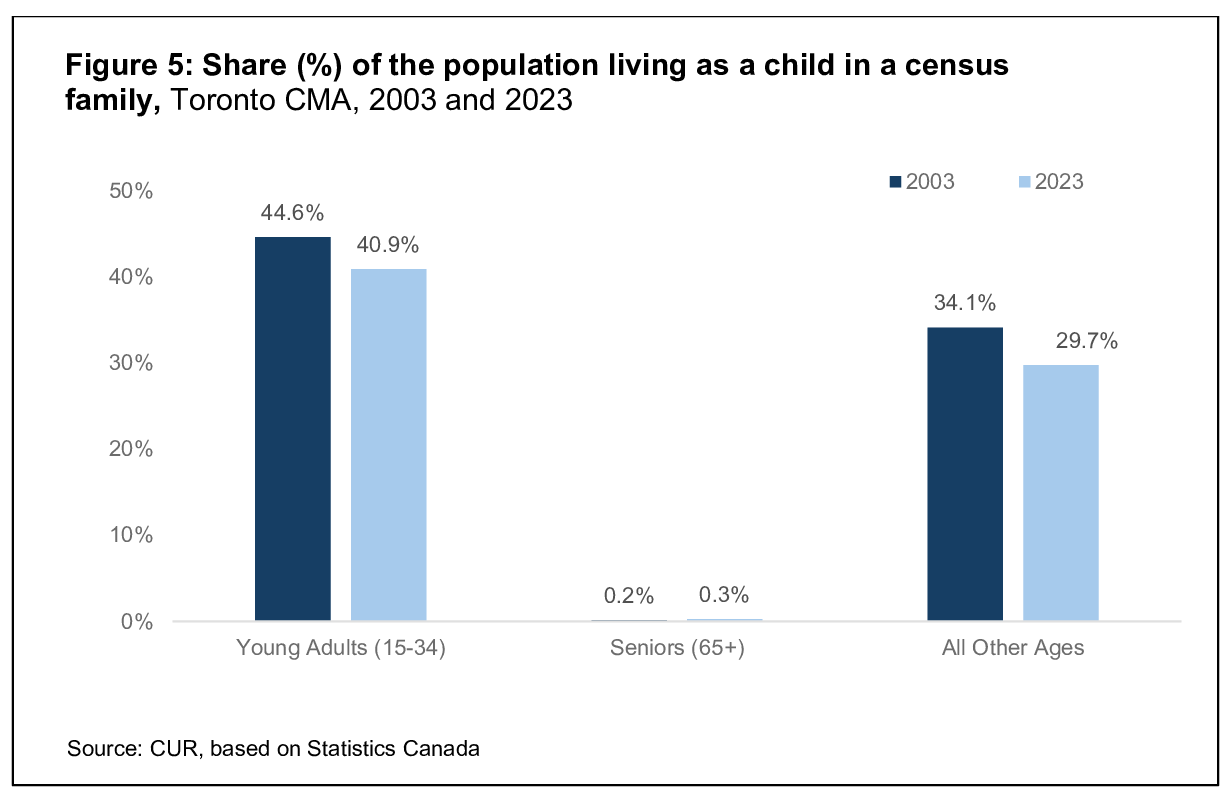
Figure 5 shows that, despite popular commentary, the share of young adults living at home with their parents fell between 2003 and 2023.
Changes in Living Arrangements: A Key Unknown
One of the wildcards in this housing equation is the living arrangements of households. Shifts in who people choose to live with can have big implications for how many actual households form.
Families and single persons can arrange their dwellings in any of the following ways:
- A census family lives alone, with no other persons (this is the most common arrangement);
- Two or more unrelated census families live together;
- A family lives in a multigenerational home (for example, grandparents, parents, children); and
- A single person lives with roommates, a relative, or a census‑family.
Unfortunately, our data on these living arrangements is limited. The most recent comprehensive source is the Statistics Canada 2021 Census.
A counterfactual exercise: suppressed households
We can estimate what the number of households would have looked like if living‑arrangements had remained at 2021 levels, given changes in age‑structure and family‑types. This is a standard economist’s tool: asking the “what if” question. What would have happened had living arrangement shares stayed stable?
We call these “suppressed households”, households that, based on age and life‑stage, historically would have formed independently (i.e., living alone or as a single census‑family household), but due to constraints (housing supply, affordability, etc.) are instead living inside someone else’s household.
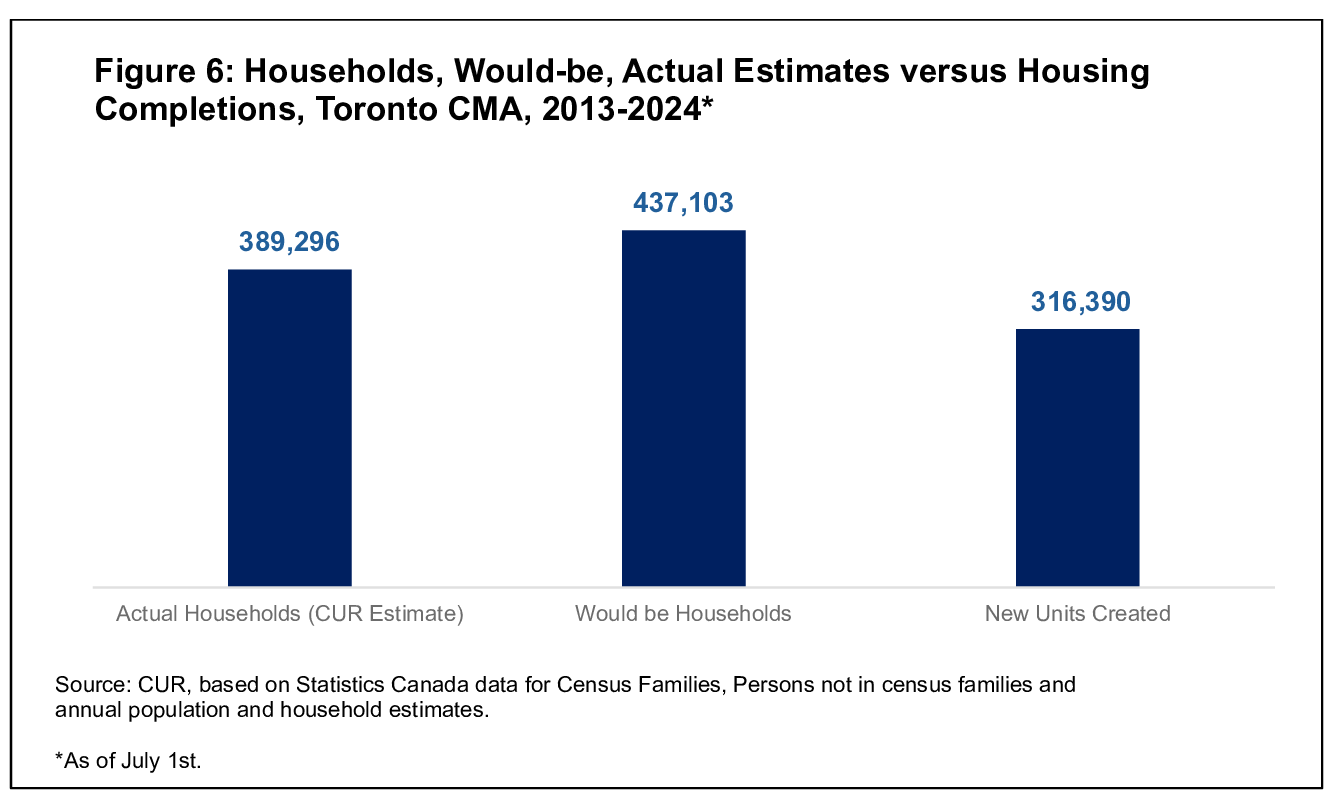
The results of the exercise show that between 2016 and 2024, there would have been about 46,000 more households in the Toronto area, had sufficient housing been built and had living arrangements stayed at the 2021 share.
Figure 5 also shows that housing completions have not kept pace with both actual household growth and these “would‑be” households.
Conclusion
Ultimately, while average household size in Toronto did tick down between 2016 and 2024, the decline is much smaller than one would expect given an aging population and a growing share of couples without children and single‑person households. In other words: household size remains higher than it would be if sufficient housing had been built and choices fully aligned with life‑stage of the population.
The shortfall in housing supply has meant that more people are living together than would have chosen, had more affordable options been available.
We encourage policy makers to review whether they are planning for both the right number and right type of housing.
End Notes
[1] Single is used to describe a person not living with a spouse or child.