Demographia’s Message: Urban Containment Policies Must Be Eased to Improve Housing Affordability in the Greater Golden Horseshoe
By: Frank Clayton, Senior Research Fellow
July 24, 2025
(PDF file) Print-friendly version available
Commentary
Demographia continues to provide a commendable global view of housing affordability. While it is unpleasant to see how poorly metropolitan Vancouver and Toronto rank internationally, metropolitan Edmonton offers hope that there are ways to maintain or even improve housing affordability by nurturing both intensification and greenfield development.
New Zealand, where affordability has been dismal for years, also offers a ray of hope for reversing the decline in affordability. According to Demographia 2025, the national government has introduced policies to significantly increase the supply of greenfield land for new housing and provide an alternative way of funding through Special Purpose Vehicles.
Demographia 2025 attributes the blame to planning policies that restrict the production of ground-related homes (singles, semis, and townhouses) on greenfield land at the fringes of metropolitan areas' built-up areas. Much of the analysis and messaging presented in the Demographia report aligns with the analysis and recommendations provided by CUR in reports and blogs spanning the past five years.
We agree that without robust greenfield development, along with built-up area intensification, the population of the Greater Toronto Area will continue to disperse as many households opt for affordable ground-related homes further afield.
Background
Demographia recently released its 2025 edition of Demographia International Housing Affordability, authored by Wendell Cox.[1] It presents middle-income housing affordability ratios for 95 global metropolitan regions, primarily in the United States (57), the United Kingdom (23), Canada (6) and Australia (5). Affordability is measured by the ratio of median resale house prices to median household income.
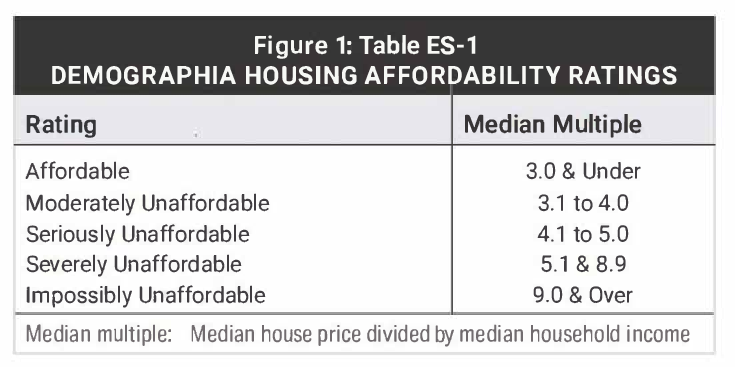
Affordability is divided into six categories from ‘affordable’ to ‘impossibly unaffordable’ (Figure 1):
This blog highlights what Demographia 2025 tells us about the housing affordability challenges in Canada broadly, as well as in several metropolitan areas, including Toronto. It also reflects on what it sees as the causes and possible corrective policies. We then assess their recommended solutions, particularly as they relate to metropolitan Toronto and other metro areas constituting the Greater Golden Horseshoe.
Affordability Facts
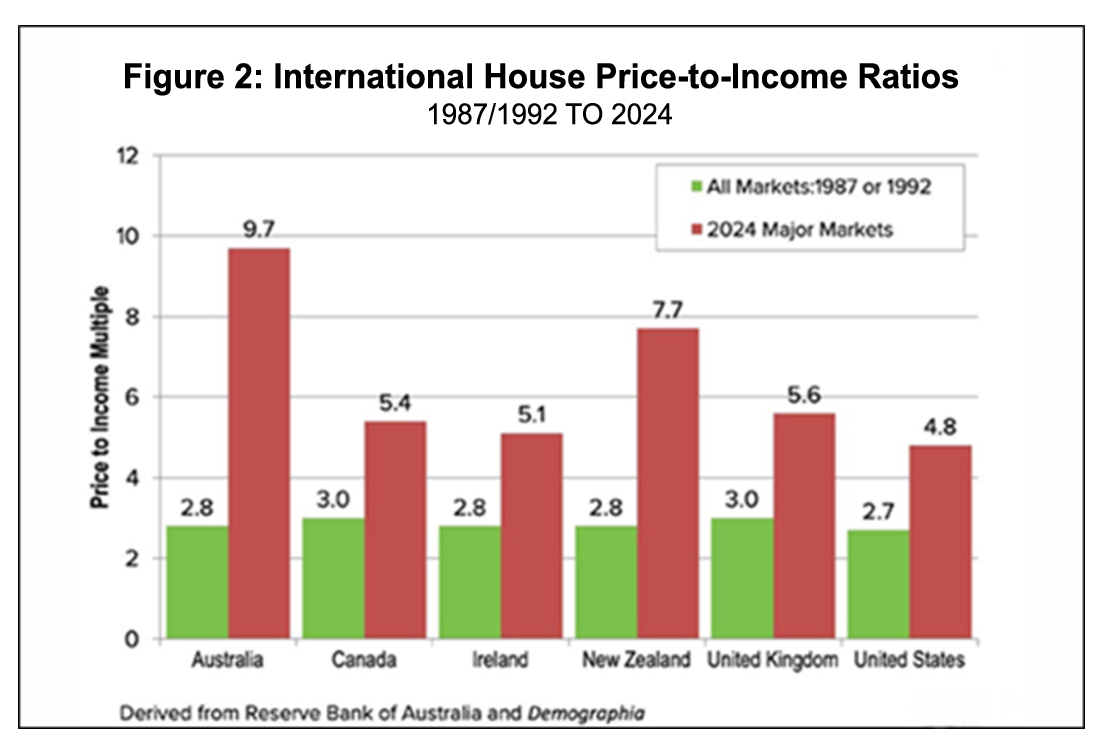
Housing affordability deteriorates across all countries, including Canada, but most in Australia and New Zealand, from 1987/1992 to 2024
Based on Figure 2, housing was ‘affordable’ in all six countries examined in the late 1980s or early 1990s (meaning a house price/income ratio of three or under). Canada’s affordability ratio was 3.0. By 2024, however, housing was unaffordable in all countries, especially in Australia (9.7) and New Zealand (7.7), where housing is now considered ‘severely unaffordable’ or ‘impossibly unaffordable’. Canada’s affordability ratio of 5.4 is labelled ‘severely unaffordable’.
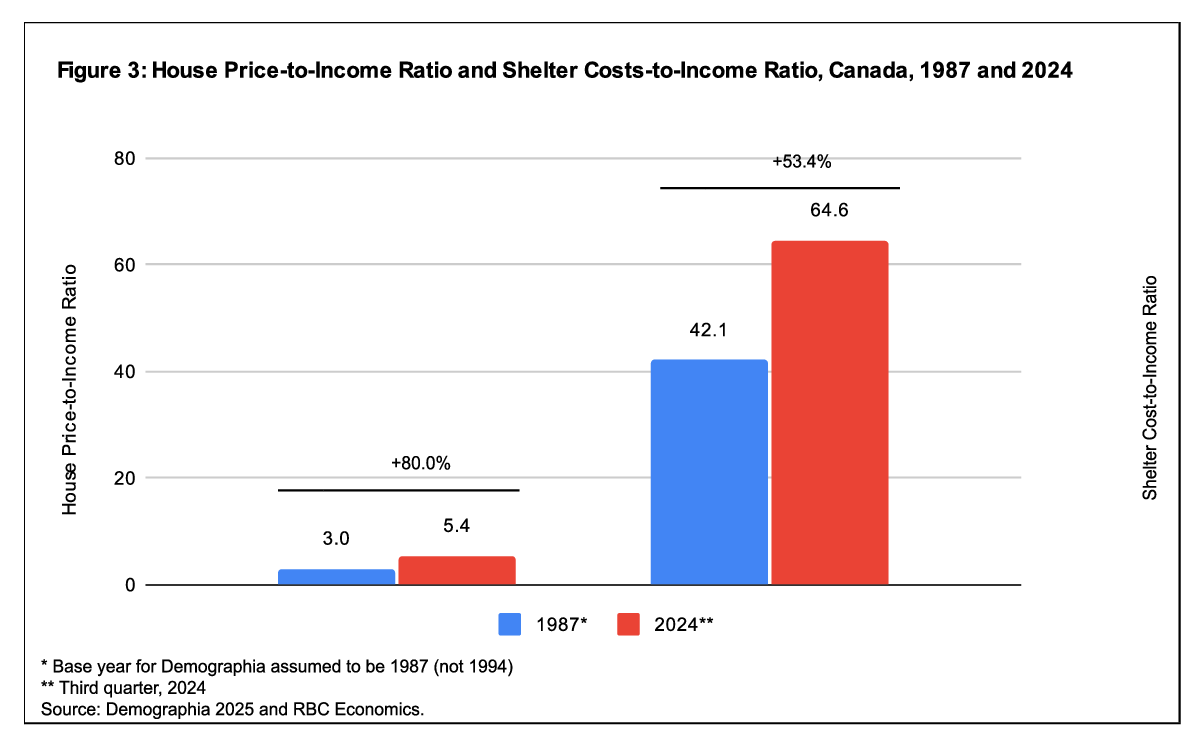
Canada’s affordability decline is pronounced whether applying the price-to-income ratio or the shelter cost-to-income ratio
The rise in Canadian house prices since the late 1980s partly reflects declining interest rates, which expanded the demand for houses and allowed buyers to buy “more house” as they qualified for larger mortgages.
As Figure 3 shows, the affordability of house purchases declined significantly between 1987 and 2024 using RBC’s affordability measure – mortgage payments and other regular costs of homeownership associated with the purchase of an average-priced house as a proportion of median household income - though less so than with Demographia’s house price-to-household income estimates.[2]
Within Canada, the decline in affordability since 2004 has been most severe in Vancouver and Toronto, with Edmonton recording little change
Figure 4 shows that Vancouver, followed by Toronto, is the poster child for unaffordability. Both regions were unaffordable in 2004, but the gap has only widened, first in Vancouver and then in Toronto. By 2024, Vancouver was ‘impossibly unaffordable’ and Toronto was ‘seriously unaffordable’. Interestingly, both regions' affordability improved marginally with the slower post-pandemic market conditions. RBC’s affordability measure follows similar patterns (not shown).
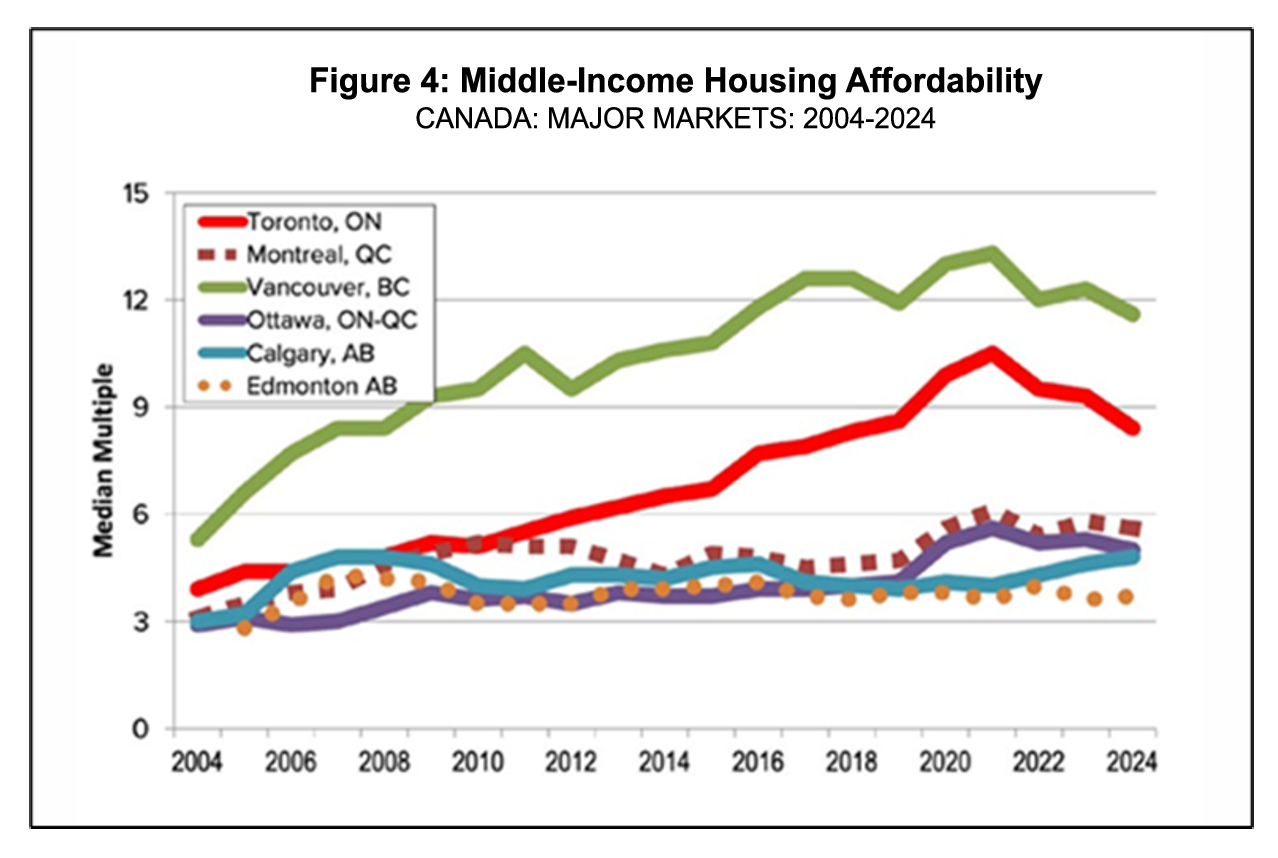
Edmonton moved from ‘affordable’ to ‘moderately unaffordable’, Ottawa and Calgary from ‘affordable’ to ‘seriously unaffordable’, and Montreal from ‘affordable’ to ‘severely unaffordable’.[3]
Demographia asserts that Toronto did not deteriorate from 1971 to 2004 but does not provide the data to support this finding.
Affordability deteriorated the least in Toronto and Kitchener-Waterloo, and the most in St. Catharines-Niagara, Guelph and London within the Greater Golden Horseshoe (GGH) between 2015 and 2023
Affordability is not as bad in the metropolitan regions outside Toronto, which form parts of the GGH. In 2023, Toronto had the highest house price/income ratio (9.3), and Barrie (7.1) and London (7.3) had the lowest.[4] Most metropolitan areas had ratios in the 7.5-7.7 range (‘severely unaffordable’).
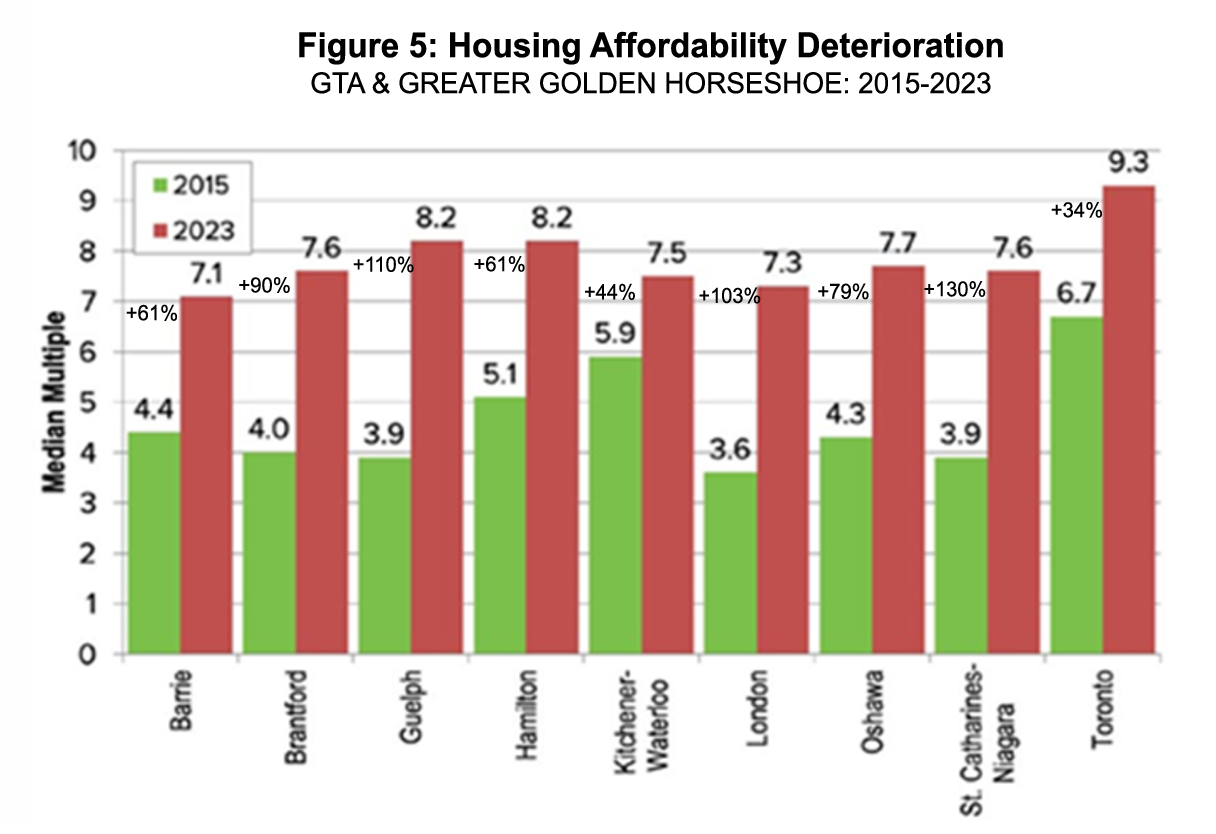
Finally, the deterioration in affordability between 2015 and 2023 was most pronounced in metropolitan areas other than Toronto and Kitchener-Waterloo - particularly St. Catharines-Niagara, Guelph and London.[5]
Demographia 2025: The Causes and Effects of Deteriorating Affordability and How to Reverse Course
Demographia: Planning policies that restrict suburban development are the dominant cause of unaffordability
Demographia blames the drop in affordability for middle-income households on planning policies restricting residential development on suburban (greenfield) lands, whether they are called urban containment, greenbelts, or compact city policies. Demographia mentions that these policies reduce the land available for ground-related housing forms, which it states that most households prefer (single- and semi-detached houses and townhouses).
“In a well-functioning market, median priced houses should be affordable to middle-income households, as they were in virtually all markets before the inception of urban containment policies. Fundamentally, urban containment seeks to stop the expansion of urban areas (urban expansion or “urban sprawl”) and increase urban population densities. This international planning orthodoxy relies on urban containment, including strategies such as greenbelts, urban growth boundaries, rural (large lot) zoning on urban peripheries, and compact city policies… They [urban containment policies] are, however, strongly associated with substantial deterioration in housing affordability, which is crucial for the future of the middle class.” (page 5)
“Urban containment, as explained by proponents, is…contrasted with traditional approaches to land use regulation by the presence of policies that are explicitly designed to limit the development of land outside a defined urban area... Each of these strategies reduces the land available for development of middle-income housing in the forms most households prefer (ground-oriented, such as detached, semi-detached, or row houses).” (page 15)
Demographia: The housing market response - counterurbanization (population dispersal)
We have often made the point that planners and politicians can control the type of housing built in their municipality. Still, they cannot control residents leaving to secure more affordable housing of the type they want.[6] Net intra-provincial migration flows between municipalities within Ontario illustrate this point. Both the city of Toronto and Peel region experience sizeable net outflows of population to other municipalities, particularly Simcoe county, and Durham and Niagara regions. We attribute these net outflows to the lack of affordable ground-related homes in Toronto and Peel.[7]
“There has been some progress. This is primarily not because of a shift in planning theory. Rather, it has come from the migration of middle-income households away from expensive markets to more affordable ones. It is not that urban planning is achieving the fundamental objective of housing affordability, but rather that households are exiting markets with urban containment and moving to smaller markets, where housing affordability is often better and the standard of living is better.” (page 18)
“This trend, particularly strong in Canada and the United States, is known as counterurbanization—movement from larger markets to suburban, exurban, or rural areas.” (page 18)
“In Canada, between 2019 and 2023, large markets (Census Metropolitan Areas) experienced a net loss of nearly 275,000 domestic migrants. Smaller markets (Census Agglomerations) gained nearly 110,000, while the rest of the country gained 165,000 (Figure 12, below). This contrasts sharply with 2004–2018, when large markets gained 19,000 and smaller markets 77,000, while the balance of the nation lost 97,000.” (page 18)
Demographia: Toward Improved Housing Affordability, the New Zealand Way
Demographia applauds recent initiatives of the New Zealand government to open up considerable land for greenfield development and establish Special Purpose Vehicles to fund infrastructure costs. It states that these efforts should lead to much lower land costs and improved housing affordability. The New Zealand policy thrust is similar to what CUR researchers recommended in 2018 to improve housing affordability in the Greater Golden Horseshoe.[8]
“To its credit, the New Zealand government has adopted a program that should lead to much lower suburban and exurban land prices, leading to materially improved housing affordability (See Section 3).” (page 19)
“The Coalition government (National/ACT/New Zealand First) is implementing a housing policy that will open a considerable amount of land to greenfield development, consistent with promises made in the 2023 election.” (page 10)
“The government’s “Going for Housing Growth” program will seek to ensure abundant developable land within and around urban areas, preventing the artificial scarcity that has driven house prices so high under the present urban containment.” (page 10)
“To finance infrastructure needs, the Coalition will use “Special Purpose Vehicles,” which allows developers or governments to finance infrastructure costs, and are repaid by beneficiaries over a period of up to 50 years. This model is similar to the Municipal Utility Districts (MUDs) in Texas and Colorado, that have relieved local taxpayers of the infrastructure burden from new greenfield housing.” (page 11)
CUR: Toward Improved Housing Affordability in the GTA, the Edmonton Way
Actions to improve housing affordability in the GTA
According to Clayton and Petramala in 2018, the four top priorities for government action to improve housing affordability in the Greater Golden Horseshoe are:
- The top priority is to increase the supply of ground-related and mid-density housing, particularly in the Greater Toronto Area (GTA), both in the short and long term;
- The second priority is to increase the supply of affordable rental housing;
- The third priority is to reduce the direct and indirect government-imposed costs embedded in the price of new housing (and indirectly the prices of existing housing); and
- The fourth priority is supporting competition in the housing industry, especially in land development.
There has been no shortage of high-rise condominium buildings constructed so these were not mentioned at the time.
Metropolitan Edmonton embodies housing affordability
The latest CMHC study confirms Edmonton's uniqueness in terms of affordability. Not only is it the most affordable of the five metropolitan areas examined by CMHC, but it is also the only metropolitan area where the projected number of housing starts under a business-as-usual scenario is sufficient to maintain housing affordability over the next decade. That is, there is no need for additional measures to promote housing affordability by increasing the housing supply.
What is special about Edmonton? While much attention is given to the city of Edmonton’s efforts to increase the supply of missing middle homes in its built-up area, the reality is that a significant amount of new housing is being built on greenfield lands, both within the city and in other parts of the metropolitan area.[9]
The lessons from metropolitan Edmonton regarding housing affordability are fourfold:
- Provide as-of-right construction of missing middle homes in existing low-density neighbourhoods;
- Maintain a plentiful supply of zoned, serviced greenfield land for new ground-related homes and low-rise apartments;
- Reduce the financial burdens imposed on new housing developments; and
- Enhance the land use planning system's flexibility and adaptability to changing market needs.
Unfortunately, the provincial and municipal governments in the Greater Golden Horseshoe continue to learn these lessons in small steps.
Demographia and CUR on the Same Wavelength
Much of the analysis and messaging presented in the Demographia report aligns with the analysis and recommendations provided by CUR in reports and blogs spanning the past five years. This finding is also consistent with the Province’s Affordable Housing Task Force, which indicates a need to facilitate the development of all housing types in both infill and greenfield locations. The recent analysis by CUR on the impacts of regulation, the need for missing middle housing, and especially greenfield development, along with demographic shifts in population and housing demand, has been referenced throughout the blog.
End Notes
[1] Wendell Cox. “Demographia International Housing Affordability.” 2025 Edition. Chapman University.
[2] RBC Economics. “RBC Affordability Measures” Data Tables. June 2025.
3] A CUR blog examined the different affordability circumstances in metropolitan Calgary, Edmonton and Toronto. It concluded that Calgary and Edmonton had a more plentiful supply of zoned and serviced greenfield land for ground-related housing formats, as well as densified sites in their built-up areas. See Frank Clayton. “The Globe & Mail Is Correct: Ontario Can Learn About Housing from Alberta But Disregards the Importance of Greenfield Development.” CUR. November 22, 2024.
[4] Demographia erroneously includes London as part of the Greater Golden Horseshoe.
[5] A CUR blog examined housing price trends in the metropolitan areas within the Greater Golden Horseshoe between mid-2020 and June 2024. See Frank Clayton. “Post-Pandemic, Housing Prices in Most Ontario Metropolitan Areas Remain Elevated Compared to Metropolitan Toronto.” CUR. September 3, 2024.
[6] See, for example, Frank Clayton. “Greenfield Development in Hamilton: Dissonance Between Council and the Public View.” CUR. February 28, 2025.
[7] Frank Clayton. “Movement of People Within Ontario Stabilizing at Pre-Pandemic Levels Including Net Outflows from Toronto and Peel.” CUR. April 2, 2025.
[8] Frank Clayton and Diana Petramala. “Action Plan for Improving Housing Affordability in the Greater Golden Horseshoe.” CUR Policy Commentary. July 17, 2018.
[9] Frank Clayton. “The Globe & Mail Is Correct: Ontario Can Learn About Housing from Alberta But Disregards the Importance of Greenfield Development.” CUR. November 22, 2025.
References
Clayton, Frank (2025). “Movement of People Within Ontario Stabilizing at Pre-Pandemic Levels Including Net Outflows from Toronto and Peel.” CUR. April 2, 2025. [Online]. Available: https://www.torontomu.ca/centre-urban-research-land-development/blog/blogentry97-movement-of-people-within-ontario-stabilizing-at-pre-pandemic-levels/.
Clayton, Frank (2025). “Greenfield Development in Hamilton: Dissonance Between Council and the Public View.” CUR. February 28, 2025. [Online]. Available: (PDF file) https://www.torontomu.ca/content/dam/centre-urban-research-land-development/pdfs/reports/CUR%20REPORT%20-%20Greenfield%20Development%20in%20Hamilton%20Dissonance%20Between%20Council%20and%20the%20Public%20View%20(Feb%2028%20final).pdf.
Clayton, Frank (2024). “The Globe & Mail Is Correct: Ontario Can Learn About Housing from Alberta But Disregards the Importance of Greenfield Development.” CUR. November 22, 2024. [Online]. Available: https://www.torontomu.ca/centre-urban-research-land-development/blog/blogentry94-globe-and-mail-correct-ontario-can-learn-about-housing-from-alberta-but-disregards-greenfield-development/.
Clayton, Frank (2024). “Post-Pandemic, Housing Prices in Most Ontario Metropolitan Areas Remain Elevated Compared to Metropolitan Toronto.” CUR. September 3, 2024. [Online]. Available: https://www.torontomu.ca/centre-urban-research-land-development/blog/blogentry89-post-pandemic-housing-prices-in-most-ontario-metro-areas-remain-elevated-compared-to-metro-toronto/.
Clayton, Frank and Petramala, Diana (2018). “Action Plan for Improving Housing Affordability in the Greater Golden Horseshoe.” CUR Policy Commentary. July 17, 2018. [Online]. Available: (PDF file) https://www.torontomu.ca/content/dam/centre-urban-research-land-development/pdfs/policycommentaries/CUR_Housing_Affordability_Policy_Recommendations.pdf.
Cox, Wendell (2025). “Demographia International Housing Affordability.” Chapman University. [Online]. Available: (PDF file) https://www.chapman.edu/communication/_files/Demographia-International-Housing-Affordability-2025-Edition.pdf (external link) .
Ontario Housing Affordability Task Force (2022). “Report of the Ontario Housing Affordability Task Force.” February 8, 2022. [Online]. Available: (PDF file) https://files.ontario.ca/mmah-housing-affordability-task-force-report-en-2022-02-07-v2.pdf (external link) .
RBC Economics (2025). “Focus on Canadian Housing.” RBC Affordability Measures Data Tables. June 2025. [Online]. Available: (PDF file) https://www.rbc.com/en/wp-content/uploads/sites/4/2025/03/Housing-Affordability_0625.pdf (external link) .