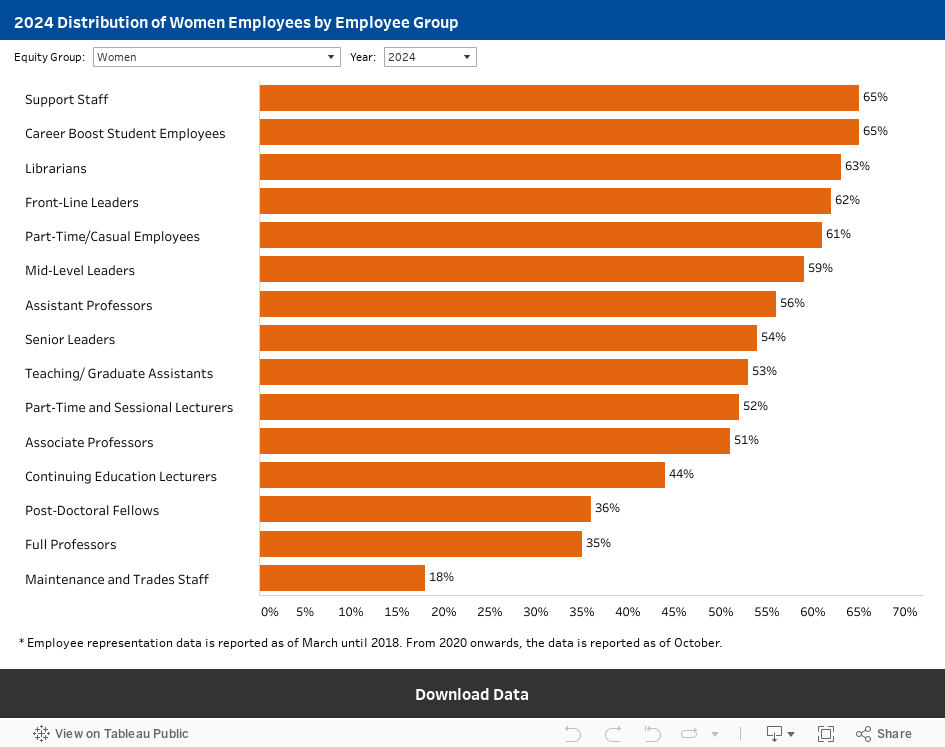
Representation by employee group
“In places where there are more women and people of colour in leadership positions, there is less likelihood of a glass cliff... I know that women in leadership positions, no matter where they are, are going to face the same challenges, but in comparison, in a progressive environment, it ought to be better.”
—Donna Young, Dean, Lincoln Alexander School of Law
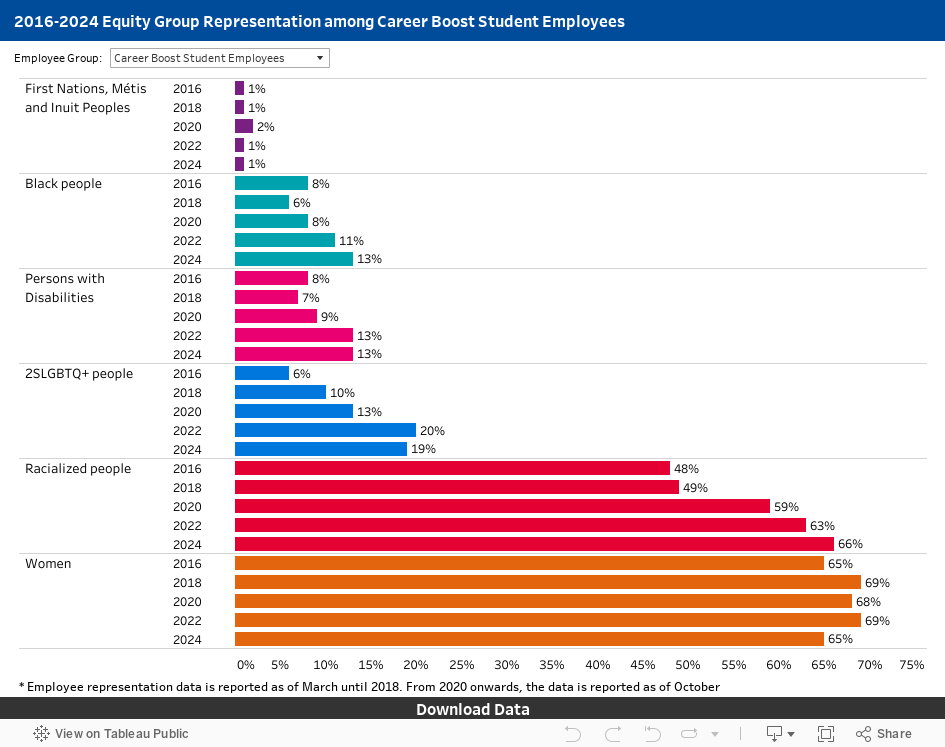
2016–2024 trends by type of work (employee group)
The 2024 Diversity Self-ID data provides an update on trends first reported in 2016. This year, we captured snapshot data on representation as of October 1, 2024, instead of March 1, 2024. The historical data from 2020 has also changed to October 1 of each year. Therefore, the trend data has changed slightly as well.
The date change was made to better capture the full complement of staff and faculty shortly after the fall semester started.
The 2024 data shows that the distribution of equity-deserving groups by employee group remained uneven, with varied representation depending on the type of work.
This suggests that social barriers continue to limit the opportunities for equity-deserving groups in some occupations. For example, gender bias in the sciences translates to a relatively low representation of women in STEM professions.
The data in the second illustration below, which demonstrates representation changes over time in employee groups, shows whether or not progress is being made in the representation of equity groups in different types of jobs.
The nine-year trend does show progress for women, racialized people, Black people, and First Nations, Inuit and Métis Peoples in many types of work at the university.
However, creative and intentional action is needed to help build diversity in the pipelines to occupations where equity-deserving groups are persistently underrepresented. The university must also work to recognize transferable skills, equivalent qualifications and excellence in different forms to make progress in the short term.
Learn more about how TMU is working to increase the representation and retention of Indigenous employees at the university.
Women
- The representation of women in senior and mid-level leadership roles increased from 2022 to 2024, along with representation in frontline leadership roles remaining above the broader community representation in the Greater Toronto Area (GTA).
- The representation of women in full professor and assistant professor ranks increased from 2022 to 2024, while the representation at the associate rank declined slightly.
- Women continue to be underrepresented in full professor roles, post-doctoral fellowships, continuing education lecturer roles and maintenance and trades roles.
Racialized people
- The trend continues with increasing representation of racialized full-time faculty in the assistant professor role, from 46 per cent in 2022 to 48 per cent in 2024, as well as at the associate rank (from 26 per cent to 31 percent). However, the representation of racialized full professors decreased from 33 per cent to 31 per cent and the representation of racialized full-time faculty is below the 57 per cent external community representation (GTA).
- The representation of racialized senior leaders increased from 25 per cent in 2022 to 34 per cent in 2024. It should be noted that the representation of racialized senior leaders continues to fall below the external community representation. In fact, the representation of racialized leaders at all levels, while it continued to increase, remained below the broader community representation of 57 per cent (2021 Census data for the GTA).
Black people
- The trend continues with an increase in the representation of Black full-time faculty in the assistant professor role, from 14 per cent in 2022 to 16 per cent in 2024. This is well above the broader community representation of 8 per cent (2021 Census data for the GTA). There was also an increase at the associate rank from three to 5 per cent. If Black full-time faculty in the assistant professor role are successful in transferring to tenure in the upcoming years, we should see increases at the associate professor and eventually at the full professor level.
- The representation of Black senior leaders increased from 4 per cent in 2022 to 7 per cent in 2024. The representation of Black mid-level leaders also increased from 6 per cent in 2022 to 7 per cent in 2024 and the representation of Black frontline leaders remained high in 2024 at 10 per cent. While the representation among mid- and senior-level leaders continues to be slightly below the broader community representation, the gap is narrowing, and the representation of frontline leaders continues to exceed the community representation.
Indigenous Peoples
- The representation of First Nations, Inuit and Métis full-time faculty in the assistant professor role increased from 6 per cent in 2022 to 7 per cent in 2024. If First Nations, Inuit and Métis full-time faculty in the assistant professor role are successful in transferring to tenure in the upcoming years, we should see increases at the associate professor and eventually at the full professor level. The representation of this equity-deserving group in frontline leadership increased from 1 per cent in 2022 to 2 per cent in 2024.
- General staff representation remains the same at two percent. Staff make up the largest full-time employee group, and it will take a focused effort to increase the number of First Nation, Inuit and Métis staff to move the needle on representation in that employee group and close the gap with the 3 per cent Ontario representation.
Persons with disabilities
- After a decrease from 15 per cent in 2020 to 9 per cent in 2022, the representation of senior leaders with disabilities remained fairly flat at 8 per cent in 2024; however, that was due to the number of senior leaders increasing in 2024, while the number of senior leaders with disabilities remained the same. Although there was a marginal increase in mid-level leaders with disabilities from 4 per cent to 6 per cent from 2022 to 2024, the representation of frontline leaders with disabilities decreased marginally from 11 per cent in 2020 to 10 per cent in 2024.
- After the representation of assistant professors with disabilities decreased from 7 per cent in 2020 to 5 per cent in 2022, it increased to 8 per cent in 2024. However, the representation of associate professors decreased from 10 per cent in 2022 to 9 per cent in 2024. Although we see some increased representation in teaching and graduate assistants and part-time and sessional lecturers with disabilities, in every employee group the representation of employees with disabilities remained well below the external community representation in Ontario (24 per cent).
2SLGBTQ+ people
- The representation of 2SLGBTQ+ senior leaders remained at 14 per cent in 2024, while the representation in mid-level leadership increased from 3 per cent in 2022 to 9 per cent in 2024 and the representation in frontline leadership increased from 10 to 12 per cent from 2022 to 2024.
- There was also another increase in the representation of 2SLGBTQ+ part-time and sessional lecturers, from 14 per cent in 2022 to 16 per cent in 2024. The representation in the assistant professor role increased from 12 per cent in 2022 to 15 per cent in 2024, while the representation of associate and full professors remained the same at 13 per cent and nine percent, respectively.
- The representation of 2SLGBTQ+ librarians increased from 17 per cent to 25 per cent from 2022 to 2024.
- Terms used to present the data, such as employee group, are defined in the glossary.
- The first bar chart shows the percentage representation on the x-axis (horizontal) and the employee groups on the y-axis (vertical). The bar for each employee group, for a selected equity group, extends to the percentage representation, showing the extent of the representation in that employee group. Looking at the bars from the top down shows the representation from highest to lowest by employee group.
- The second bar chart shows the equity groups on the y-axis (vertical) for 2016, 2018, 2020, 2022 and 2024, with the x-axis (horizontal) showing the percentage representation. The bar for each equity group and year extends to the percentage representation, showing the extent of the representation of each equity group in each year for the selected employee group.
- This interactive data is produced using Tableau data visualization software. Users can see the data that corresponds to the visual by hovering or clicking over portions of the illustration. The data can also be explored using keyboard shortcuts (external link) .
- To explore the data further or in a different format, the aggregated data can be downloaded and saved in a variety of formats such as Google Sheets, MS Excel, CSV and more, using the link at the bottom end of the graph or chart. Downloads are provided for the data in a graph or chart based on user selections. For example, in the first bar chart below, the data provided for download would be based on the equity group and year selected, and for the second chart, the selection would be for the employee group.
Note: Support staff refers to administrative, operational, technical and professional non-academic support staff who are not in faculty or leadership roles. This includes OPSEU and MAC confidential full-time career, partial-year and long-term contract staff.
Need the data in an alternative format?
Accessibility is an important goal for us. If you have questions or if the data visualization content is not accessible using the features and alternate formats described above, please contact the Research, Planning and Assessment unit in the Office of the Vice-President, Equity and Community Inclusion at diversitydata@torontomu.ca for further assistance.