Full-time faculty, librarian and staff representation by faculty or division
“When we recognize and understand specific forms of discrimination, exclusion, racism and sexism...let us not forget the power of making common cause, the power of representation and solidarity... Let resistance to all forms of discrimination be the force that binds us.”
—Anver Saloojee, Professor, Department of Politics and Public Administration and
former Assistant Vice-President, TMU International (Alan Shepard Awards Ceremony, 2020)
Addressing gaps in and beyond representation
Now is a time to leverage policies and practices at the university that help preserve and expand the progress that has been made. Initiatives in some areas, such as cohort hiring, can continue to be used to address gaps in representation and enhance inclusion, while serving as an example to other areas that have not shown similar outcomes. The data does not tell the full story of progress, or barriers that prevent progress. Therefore, Diversity Self-ID data should be seen as an indicator of patterns and trends in representation, recruitment and retention. These indicators suggest areas for further discussion and exploration.
It is also important to recognize that while there are areas of the university that already reflect the broader community and/or student representation of one or more equity groups, there are still gaps to be addressed and targets to be set. For example, areas where the representation of women employees is at or above the broader community representation can look to hire more racialized women or women with disabilities. In addition, leaders can look within their areas to see if women are concentrated in some areas or jobs and start to address some of the issues indicated by that pattern.
Progress on diversity alone will not lead to sustainable change. It is equally important to take action to ensure that diverse employees are supported in achieving their potential, and that the university provides a culture of inclusion across all faculties and divisions so that employees can bring their whole authentic selves to work.
Please also explore the section showing hiring, exit and promotion data by Faculty/division to gain further insights so that any representation gaps can be reduced and eventually eliminated.

Supports and resources are available to increase the representation, recruitment and retention of employees from underrepresented groups, set targets and take bold action to bring about substantial and lasting change.
The Office of the Vice-President, Equity and Community Inclusion assists leaders by providing:
- The Diversity Self-ID data, which provides insights into where we have and have not made progress in improving our progress in different areas of the university and types of jobs. The data indicates issues to discuss and explore further.
- Strategic consultations and more detailed data for leaders, available upon request, to develop more specific, tailored plans and actions.
- Guidance for hiring diverse faculty. Many of the suggestions can apply to hiring staff as well.
- Learning programs to be aware of that help to counteract implicit biases and microaggressions, and integrate values of equity, diversity and inclusion into a human-rights-centered work environment, so that all employees are included and can reach their potential.
Human Resources and the Office of the Vice-Provost, Faculty Affairs can also assist leaders by:
- Providing aggregated applicant self-ID data to help identify areas where new outreach initiatives are needed, along with ways to remove biases and become more equitable and inclusive in assessing excellence in different forms.
- Providing applicant self-ID information to Department Hiring Committees (DHCs) to help incorporate equity, diversity and inclusion into recruiting and selecting full-time faculty hires.
- Establishing equity, diversity and inclusion competencies and providing advice on inclusive career development and succession planning.
- Talent Acquisition Management can assist with sourcing excellent Indigenous candidates and connecting First Nations, Métis and Inuit (FNMI) employees to community networks and supports.
- Terms used to present the data, such as employee group, are defined in the glossary provided.
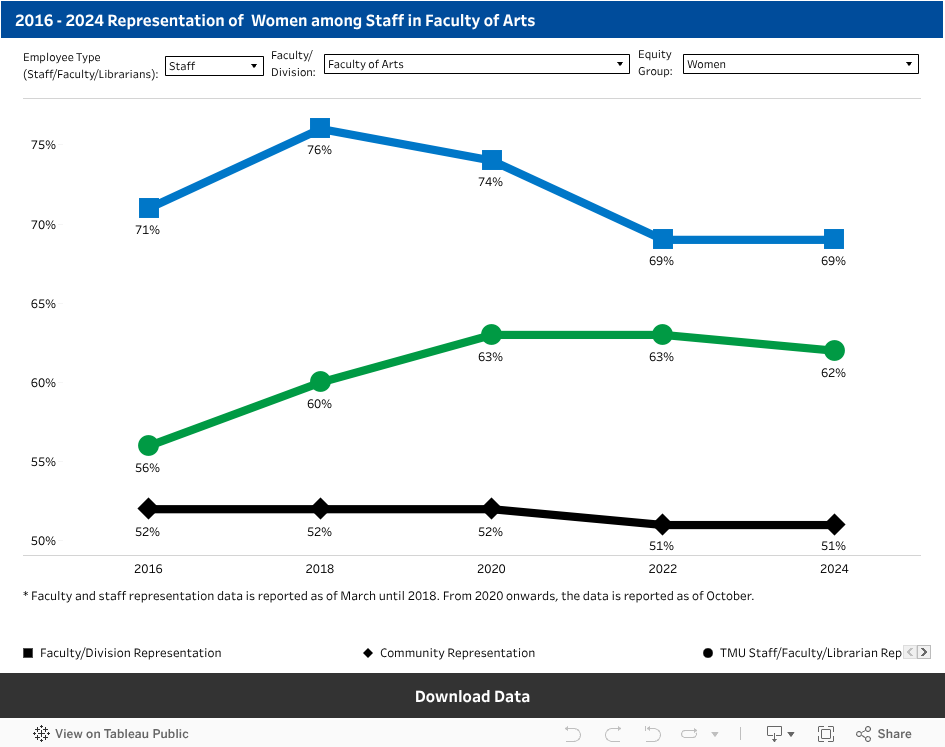
- The line chart below shows the years from 2016 to 2024 on the X-axis (horizontal) and the percentage representation for each year on the Y-axis (vertical). The representation data will be shown based on the selection of staff, librarians or faculty, the selection of a specific Faculty or division, and the selection of an equity group.
- Lines appear in different colours and with different symbols. The legend shows which symbol is used for the Faculty/division representation, the TMU staff or full-time faculty representation and for the community representation. The legend does not show the colour used for each, which is Black for the Faculty/division representation, green for the TMU representation and red for the community representation.
- This interactive data is produced using Tableau data-visualization software and is best viewed on laptops or desktops rather than mobile devices. Users can see the data that corresponds to the visual by hovering or clicking over portions of the illustration. The data can also be explored using keyboard shortcuts (external link) .
- To explore the data further or in a different format, the aggregated data can be downloaded and saved in a variety of formats such as Google Sheets, MS Excel, CSV and more, using the link at the bottom end of the graph or charts below. Downloads are provided for the data in a graph or chart based on user selections. For example, in the bar chart below, the data provided for download would be based on the selection of employee type, Faculty/division and year.
Need the data in an alternative format?
Accessibility is an important goal for us. If you have questions or if the data visualization content is not accessible using the features and alternate formats described above, please contact the Research, Planning and Assessment unit in the Office of the Vice-President, Equity and Community Inclusion at diversitydata@torontomu.ca for further assistance.