Full-time faculty, librarian and staff promotions by faculty or division
“Resources and practices such as flexible work arrangements, inclusive spaces and compassionate leadership together support all employees to thrive, not just for those with diagnosed disabilities. Further, this proactive approach facilitates wellbeing and productivity.”
—Melissa Eluik, School of Urban and Regional Planning
The data provided in this section includes information about the promotion of faculty, librarians and staff from equity-deserving groups, by faculty or division, to help identify where improvements can be made in providing equitable opportunities for diverse talent.
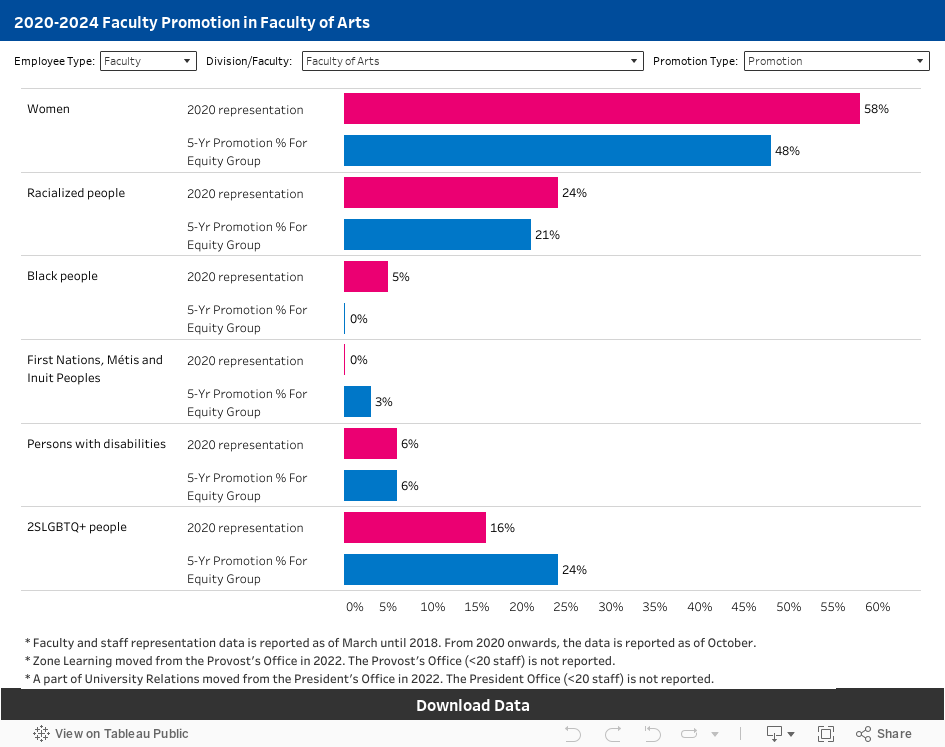
The percentage of staff from equity groups who were promoted in the five-year period from 2020 to 2024 is shown along with the 2020 representation data of staff in the faculty or division. These two pieces of data should be looked at together, to see if the share of promotions reflects a similar percentage as the representation at the beginning of the five year period.
Similarly, the percentage of librarian promotions, and the librarian equivalent of transfer to tenure, from 2020-2024, is provided together with the 2020 librarian representation. The percentage of full-time faculty in each equity group who were transferred to tenure from 2020-2024 is shown together with the 2020 representation of assistant professors from that equity group in the faculty, and the percentage of full-time faculty promotions from each equity group is shown together with the 2020 representation of associate professors from that equity group in the faculty.
This comparison provides an indicator of whether or not staff, faculty and librarians from equity groups had equitable opportunities for promotion.
The data doesn’t tell the full story, but where the data suggests that the opportunities are not proportionate to the representation, it can be used to consider whether further exploration and discussion is needed about what barriers might exist and how to remove them.
Some factors to consider are whether or not every employee is being given the opportunity to take on assignments that expand their skills, or provided with learning opportunities such as leadership development. Are the voices of employees from underrepresented equity-deserving groups heard? Do all faculty and staff have the resources and chances to excel?

- Terms used to present the data, such as employee group, are defined in the glossary.
- The bar chart below shows the percentage representation on the X-axis (horizontal), and the promotions and the 2020 faculty or division representation for each equity group on the Y-axis (vertical). The bars extend to the percentage. For the bar showing equity-deserving group promotions over the five-year period, along with the bar showing faculty or division 2020 representation of the equity group, the data shows whether promotions were proportional to the representation at the beginning of the five-year period in the feeder rank.
- This interactive data is produced using Tableau data visualization software called and is best viewed on desktops or laptops rather than tablets and mobile phones. Users can see the data that corresponds to the visual by hovering or clicking over portions of the illustration. The data can also be explored using keyboard shortcuts (external link) .
- To explore the data further or in a different format, the aggregated data can be downloaded and saved in a variety of formats such as Google Sheets, MS Excel, CSV and more, using the link at the bottom end of the graph or charts below. Downloads are provided for the data in a graph or chart based on user selections. For example, in the bar chart below, the data provided for download would be based on the selection of employee type, faculty or division and promotion type.
Notes
- Staff includes full-time career (FTCE) partial-year (PYE) and long-term contract staff.
- Staff promotions include reclassifications to a higher grade level as well as moving to a different job in the division or faculty (including from another division or faculty) with a higher salary.
- Staff promotions for each equity-deserving group are calculated as a percentage of all staff promotions during the five-year period in the division or faculty.
- Full-time faculty and librarian transfers to tenure for each equity-deserving group are calculated as a percentage of all the faculty or librarian transfers to tenure during the five-year period in the faculty or library.
- Full-time faculty and librarian promotions for each equity group are calculated as a percentage of all the faculty or librarian promotions, to full professor or higher librarian ranks, during the five-year period in the faculty or library.
Need the data in an alternative format?
Accessibility is an important goal for us. If you have questions or if the data visualization content is not accessible using the features and alternate formats described above, please contact the Research, Planning and Assessment unit in the Office of the Vice-President, Equity and Community Inclusion at diversitydata@torontomu.ca for further assistance.