Full-time faculty, librarian and staff hires and exits by faculty or division
“I think it helps us to expand how we think of disability, not as this deficit or not as this way of living that is less than. But really it allows us to think about new perspectives and really important ways of engaging with the world...”
—Sean Lee, Curator and Director of Programming at Tangled Art + Disability
(Art at the Intersection of Visible and Invisible Identities, 2019)
The data provided in this section includes information about hires and exits of faculty, librarians and staff from equity-deserving groups, to identify where progress is or isn’t being made in bringing in and/or retaining excellent diverse talent at the university.
The data does not tell the full story of progress, or barriers that prevent progress. Diversity Self-ID data should be seen as an indicator of patterns and trends in representation, recruitment and retention. These indicators suggest areas for further discussion and exploration.
For example, an area that has not hired faculty or staff from an under-represented equity group should discuss how to extend outreach efforts and make their hiring processes more inclusive, as well as consult with talent acquisition staff in Human Resources.

To understand the hiring and exit data, it is important to connect it with the representation and promotion data, along with knowledge of organizational changes in the faculty or division during the five-year period.
- Any reorganizations where staff who reported to one division become part of a different division can impact the understanding of hiring, exit and representation data.
- Other faculty or division specific contexts can lead to little or no increase in representation, such as few hiring opportunities.
- In addition, the result of efforts to increase the diversity of faculty, librarians and/or staff may have led to more recent progress. The data reporting will always be around a year behind the current state. These factors need to be considered together with the data.
Connecting different pieces of data is important to understanding the exit data as well. If there is high representation of an equity-deserving group in a faculty or division, then it is more likely that there will be exits from that group.
For example, if women represent 80 per cent of faculty or staff in a faculty or division then it is likely that they will make up a proportionate share of the exits. However, if there is a disproportionately higher percentage of exits from an equity group, or even a similar percentage of exits to the representation in the faculty or division, possible retention strategies should be discussed and explored. It is important to identify and stop “revolving doors” of faculty and staff from equity-deserving groups, where they exist.
As an example, one area of investigation concerning exits or stagnation of faculty or staff from equity-deserving groups might include reviewing the promotion data and consulting with talent management staff in Human Resources.
For academic hires, full-time faculty includes limited-term faculty and tenure-stream faculty. Staff hires include full-time career and long-term contract hires to the university and/or the faculty or division.
Exit data includes tenure-stream faculty and full-time career staff resignations and terminations. It does not include retirements since exit data is provided as a retention indicator. Long-term contract staff are also not included in the exit data, as it is not possible to accurately distinguish between a contract employee who resigned versus one who left because their work and contract ended.
- Terms used to present the data, such as employee group, are defined in the glossary.
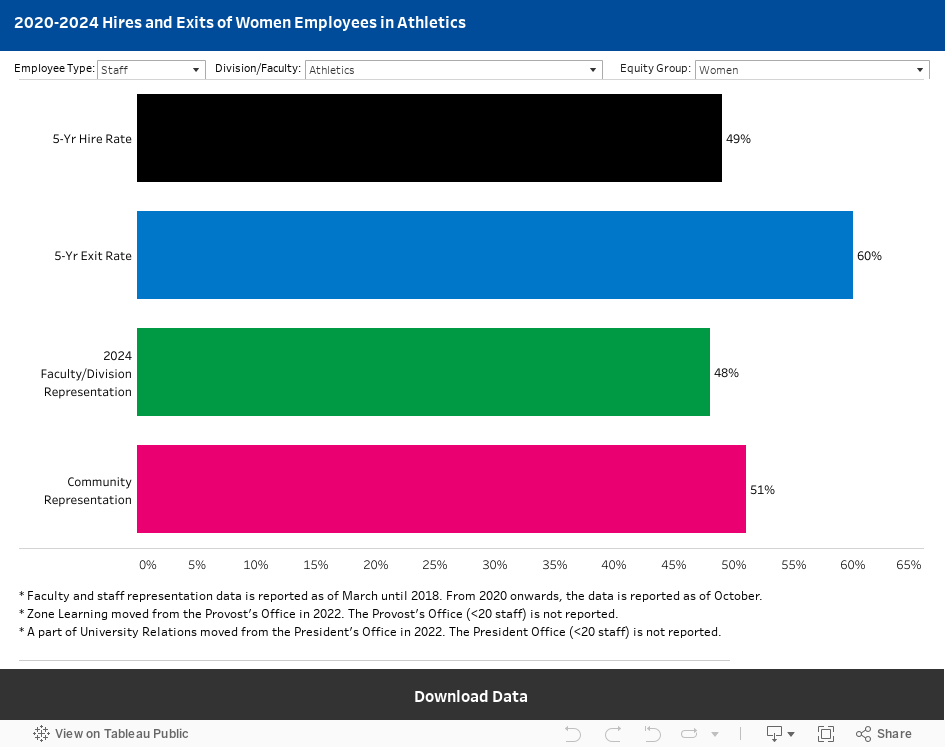
- The bar chart below shows the percentage representation on the X-axis (horizontal) and the hires, exits, 2024 faculty/division representation and community representation on the Y-axis (vertical). The bars extend to the percentage. For hires and exits over the past five years, along with the faculty or division 2024 representation and community representation, the bars show how recruitment and retention may have influenced the current state and any continuing gaps.
- This interactive data is produced using Tableau data visualization software and is best viewed on desktops and laptops rather than mobile devices. Users can see the data that corresponds to the visual by hovering or clicking over portions of the illustration. The data can also be explored using keyboard shortcuts (external link) .
- To explore the data further or in a different format, the aggregated data can be downloaded and saved in a variety of formats such as Google Sheets, MS Excel, CSV and more, using the link at the bottom end of the graph or charts below. Downloads are provided for the data in a graph or chart based on user selections. For example, in the bar chart below, the data provided for download would be based on the selection of employee type, faculty or division and equity-deserving group.
Need the data in an alternative format?
Accessibility is an important goal for us. If you have questions or if the data visualization content is not accessible using the features and alternate formats described above, please contact the Research, Planning and Assessment unit in the Office of the Vice-President, Equity and Community Inclusion at diversitydata@torontomu.ca for further assistance.