Residential Property Taxes: Effective Rates and Burdens for Census Metropolitan Areas within the Great Golden Horseshoe, 2021
By: Frank Clayton and Brooke Adams
August 8, 2023
(PDF file) Print-friendly version available
Background
This blog provides background on property taxes paid by homeowners living in the nine census metropolitan areas (CMAs) in the Greater Golden Horseshoe (GGH), as reported by the 2021 Census of Canada.[1]
Three aspects of property taxes are examined:
- Average property tax payment[2]
- Average effective tax rate – property taxes as a percentage of the market value of the owner-occupied homes[3]
- Average tax burden – property taxes as a percentage of homeowners' average household income[4]
The text references only CMAs; an appendix table contains data for the municipalities within each CMA.
Average Property Tax Payments[5]
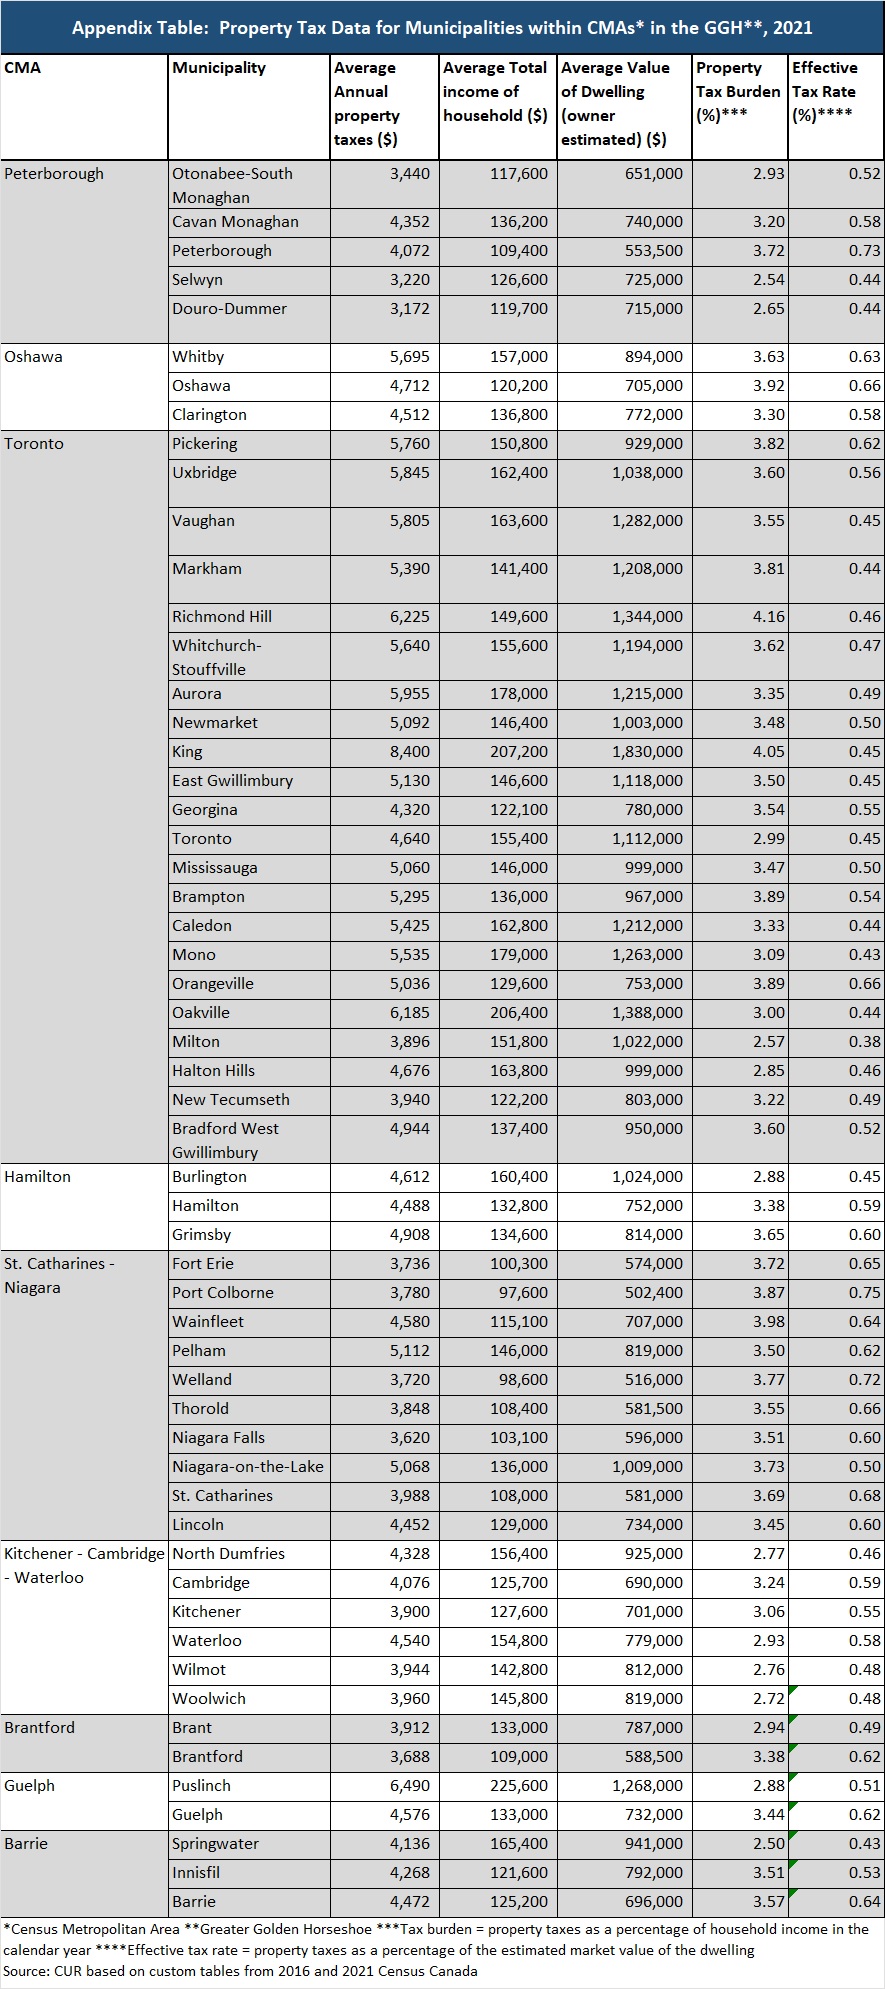
Figure 1 shows that the average residential property tax payments in 2021 were highest in Toronto and Oshawa ($5,080 and $5,008, respectively) and lowest in Brantford and Peterborough ($3,760), a difference of about 25%.
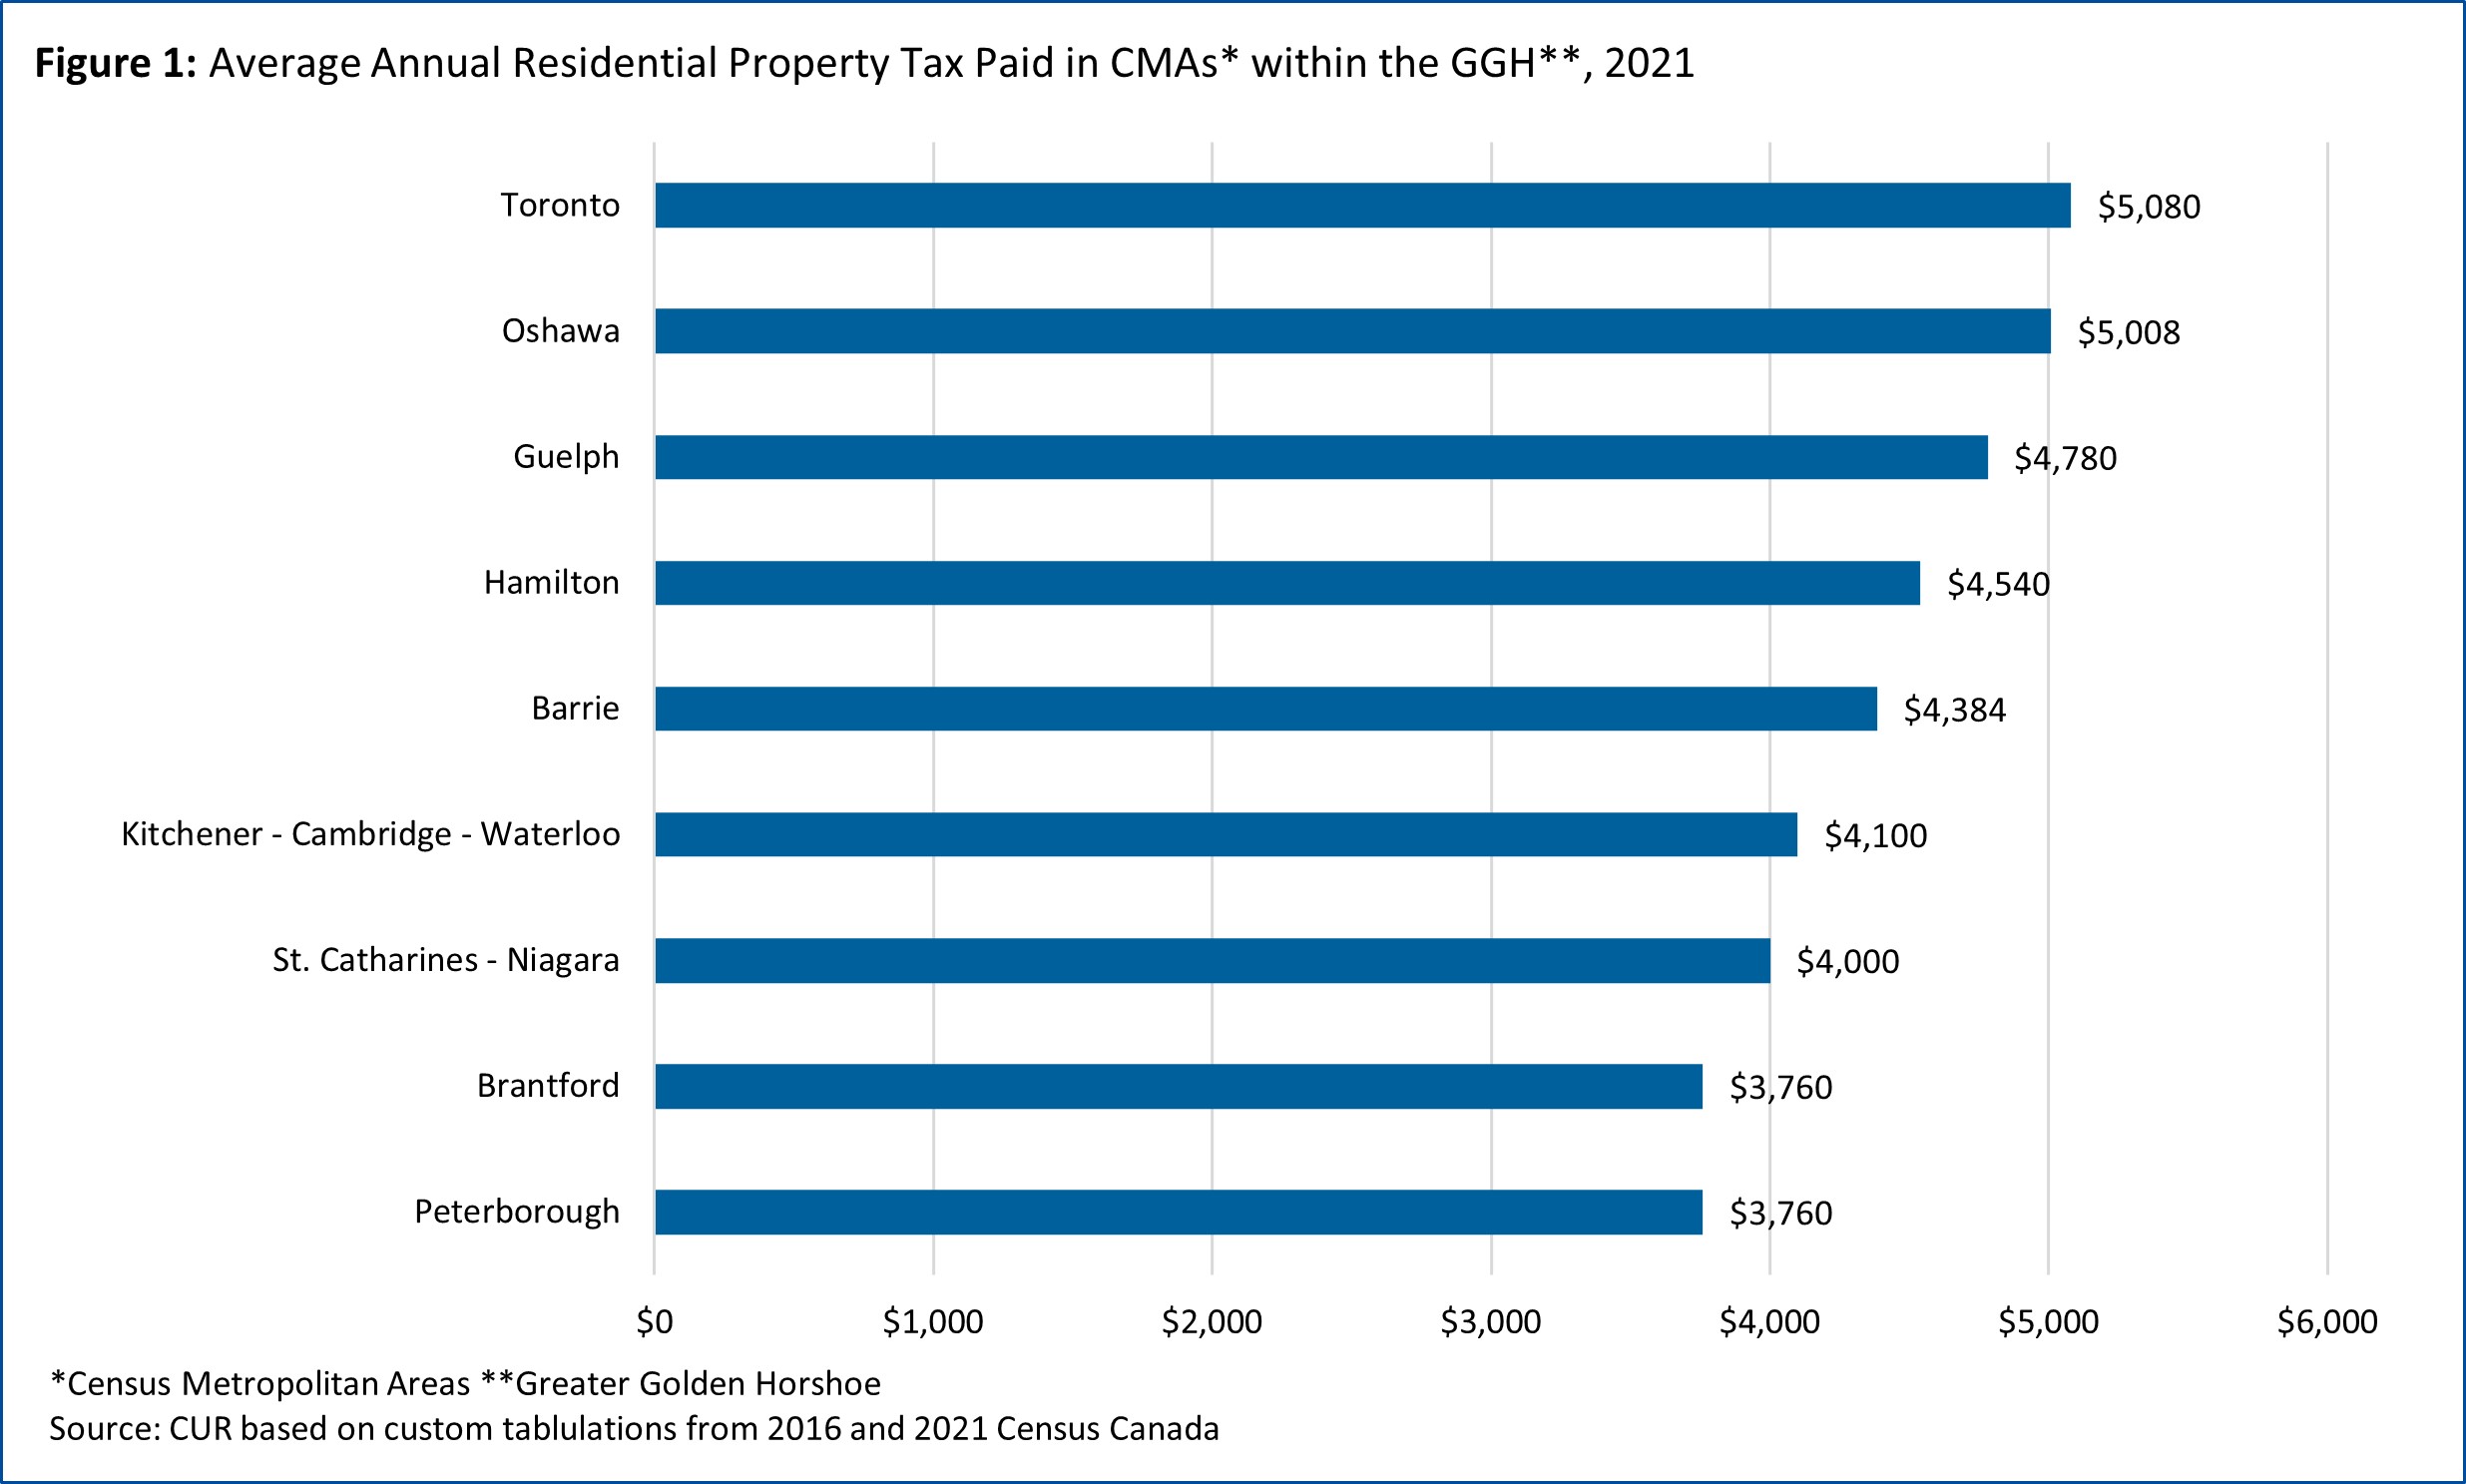
Figure 2 illustrates there is a rough relationship between population size and average property taxes paid. Toronto is the largest CMA, with a population of 6.2 million, and Brantford and Peterborough are the smallest in size with 144,162 and 128,624 persons, respectively.
There are exceptions to a direct relationship between population size and average taxes paid:
- Property taxes in Oshawa and Guelph are higher than would be expected by their population ranking; and
- Property taxes in Kitchener-Cambridge-Waterloo, St. Catharines-Niagara, and Hamilton are lower than their population ranking indicates.
Effective Property Tax Rates
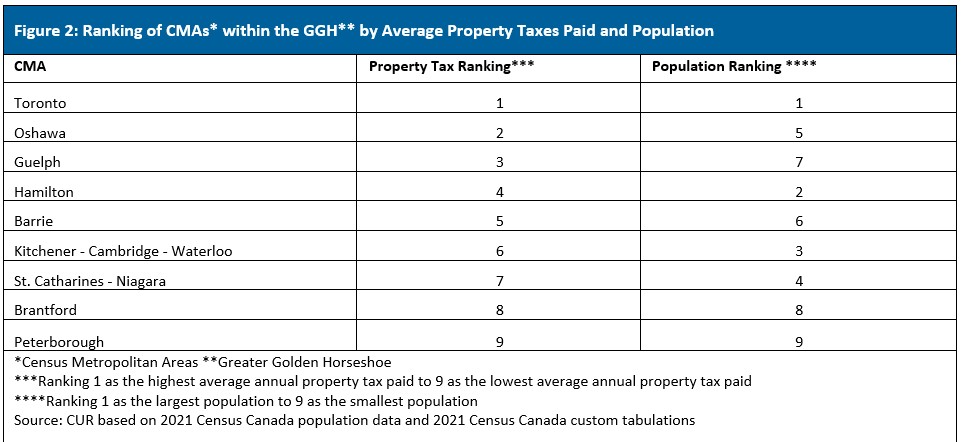
The effective property tax rate (property tax payment as a percent of estimated home value) ranged from a high of 0.64% - 0.65% in St. Catharines-Niagara and Oshawa to a low of 0.46% in the Toronto CMA (see Figure 3).
Several CMAs have room to generate more tax revenue by increasing their effective tax rate. For example:
- Increasing Toronto's effective tax rate to the GGH's highest tax rate (0.65% in St. Catharines-Niagara) would produce 41% more property tax revenue;
- Increasing Toronto's tax rate to the second lowest CMA (Hamilton at 0.55%) would produce 20% more tax revenue; and
- Increasing Toronto's effective tax rate to the median CMA (Barrie at 0.59%) would generate 28% more tax revenue.
Property Tax Burdens
The residential property tax burden (property tax payments as a percent of average household income) ranged from a high of 4.59% in St. Catharines-Niagara to a low of 2.79% in Kitchener-Cambridge-Waterloo (see Figure 4). Toronto was third lowest at 3.08%.
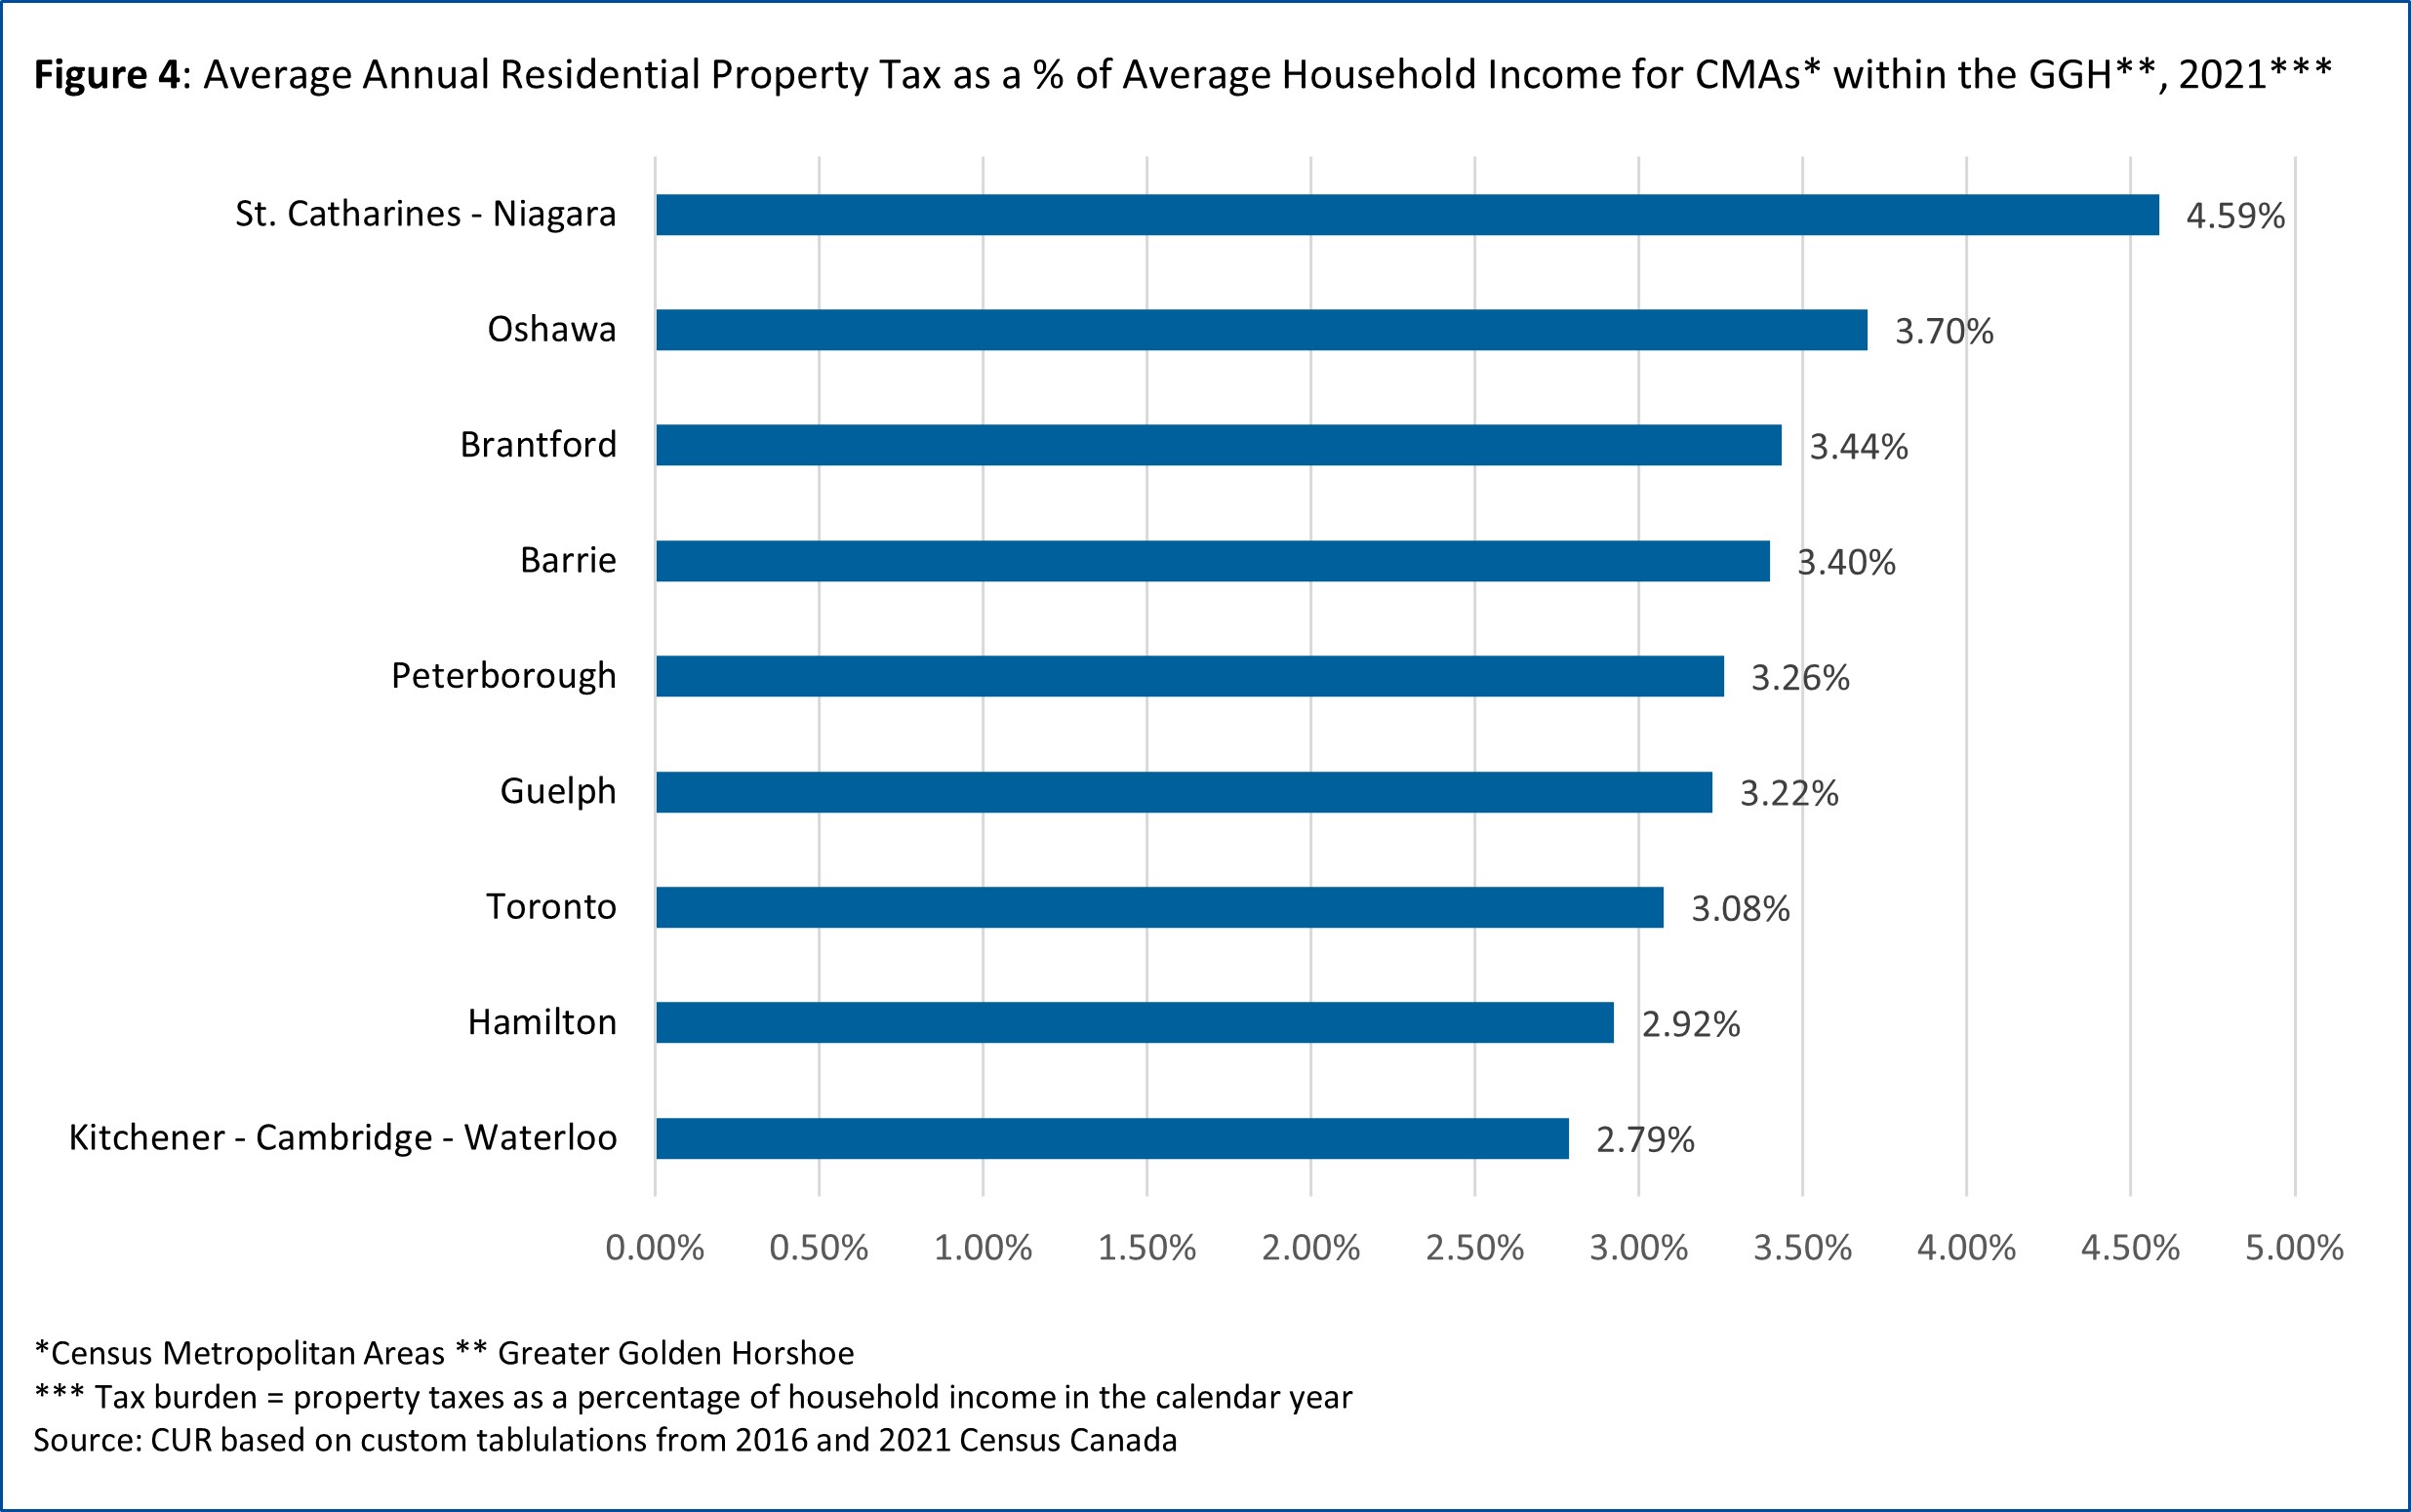
Again, several CMAs have room to raise more tax revenue by increasing their property tax burdens. For example,
- Increasing Toronto’s property tax burden to the highest (i.e., 4.59% in St. Catharines-Niagara) would yield property tax revenues by 49%; and
- Increasing Toronto’s property tax burden to the median CMA (i.e., Barrie at 3.4%) would raise an additional 10% in tax revenue.
Conclusion
There are considerable variations between the nine CMAs in the GGH concerning effective property tax rates and property tax burdens for owner-occupied housing. The fact that the CMAs with the highest effective tax rates and burdens have robust housing markets suggests that CMAs with lower tax burdens and effective tax rates have room to raise them to produce more property tax revenues. These include Toronto, Hamilton, and Kitchener-Cambridge-Waterloo. This conclusion applies to the CMAs as a whole not to every municipality within them.
Endnotes
[1] The data are from custom tabulations of average annual property tax, property values, and household incomes CUR ordered from Statistics Canada by municipality within the nine CMAs in the GGH. Lists of the municipalities included in each CMA are available in the Appendix Table.
[2] Includes homeowners in all types of owner-occupied dwellings including condominiums where the owners pay property taxes directly. Excludes owners paying property taxes in their monthly payments to their mortgage lender.
[3] Estimates of the market value of owner-occupied dwellings made by respondents to the long census questionnaire.
[4] Estimated property tax payments in 2016 as a percent of household income in the calendar year 2015.
[5] Not all municipalities fund the same services through the property tax. Some services in some municipalities may be funded through user charges rather than property taxes. No allowance is made for these financing differences.
Data Sources
Statistics Canada. (2023). Census of Population, Census Profiles, Ontario, Census Metropolitan Areas. [Online] Available: https://www12.statcan.gc.ca/census-recensement/2021/dp-pd/prof/search-recherche/lst/results-resultats.cfm?Lang=E&GEOCODE=35 (external link)
Appendix
A Canadian Census Metropolitan Area (CMA) consists of one or more adjacent municipalities centred on a population center (the core). A CMA must have a population of at least 100,000, of which 50,000 or more must live in the core. The adjacent areas to the urban core are included in the CMA if 50% of the resident population commutes into the core for work and 25% of the jobs are filled by commuters from the core or the municipality directly touches or is partly within the urban core.
Appendix Table
The following table provides the data in Figures 1, 3 and 4 for individual municipalities. First Nation reserves are excluded.