The Gainers Are Many When Toronto and Peel Bleed Population
By: Frank Clayton and Nigel Alphonso, TMU CUR
March 27, 2023
(PDF file) Print-friendly version available
Summary
The net outflow of residents living in the Greater Toronto Area (GTA) to the outer Greater Golden Horseshoe (GGH) and other locations in Ontario continued to increase in 2022. The deterioration in the affordability of single-detached and semi-detached houses and the low production of potential substitutes like townhouses, stacked townhouses and other forms of low-rise apartments (so-called missing middle housing), within the GTA are likely contributors to these population flows.
In the 12 months up to July 1, 2022, Toronto, Peel, and York recorded a net outflow of 85,615 intraprovincial migrants. For the six years ending July 1, 2022, these three municipalities experienced a net outflow of 397,806 residents. The other two GTA regions, Durham and Halton, recorded net inflows of intraprovincial migrants but these were not large enough to counter the net outflows in the other three jurisdictions.
Simcoe (60,567) was the top area in terms of net in-migrants over the latest six years followed by Durham 45,560) and Niagara (28,394).
The provincial government recently established aspirational targets for many GTA and outer GGH municipalities to increase housing production significantly over the next decade. Unfortunately, these targets are for total units only and not by type. To the extent the targets are met, the new housing will mostly be mid and high-rise apartments rather than the low-density and missing middle housing forms that many households demand. Thus, we anticipate the net outflow of residents from the GTA will persist over the next decade.
Background
Last year, CUR released a report documenting estimates of the annual net outflow of the resident population from the GTA to other parts of Ontario for the 12 months up to July 1, 2021.1
These migration estimates (called net intraprovincial migration) reflect the net inflow or net outflow of the population between the 50 census divisions within the province. Net intraprovincial migration is zero for the province. Census divisions include single-tier municipalities (e.g., Toronto, Hamilton), regional municipalities (e.g., Peel, Halton) and counties, including their separate municipalities (e.g., the Simcoe County census division incorporates the population of Barrie and Orillia). The latest net intraprovincial migration figures are subject to revision by Statistics Canada of intraprovincial migration.
A significant finding in last year’s blog was that Toronto and Peel had more net population loss in 2021 than in 2020. Moreover, this continued a longer-term trend and was not unique to the pandemic period.
The Statistics Canada estimates do not allow pinpointing where residents from Toronto and Peel are going. Therefore, all we can say with certainty is which census divisions have net population change due to the net flow of population from and to other census divisions in the province.
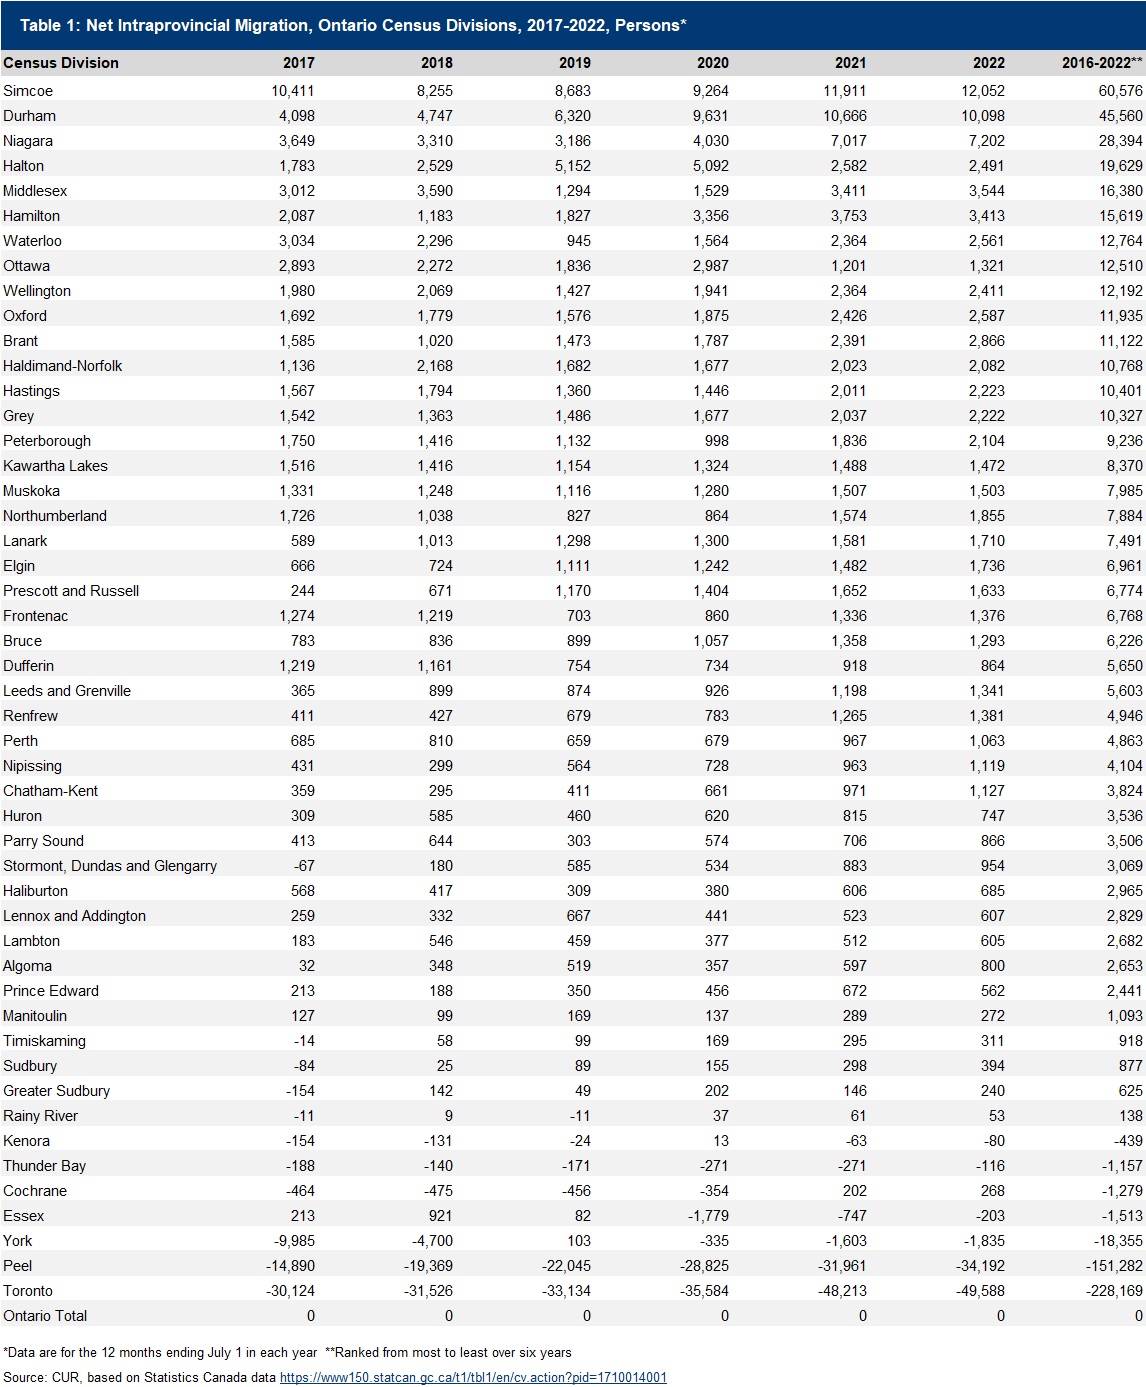
A table at the end of this blog shows net intraprovincial migration estimates for all census divisions in Ontario for each of the six years ending July 1, 2022, and for the six years combined. The census divisions are ranked from the largest net influx to the largest net outflux during the six years. Toronto and Peel bleed residents in large numbers – seven census divisions lost 402,194 net residents over six years – almost all losses occurred in the GTA.
Figure 1 presents the net intraprovincial migration estimates for the seven census divisions losing population between 2017-2022.
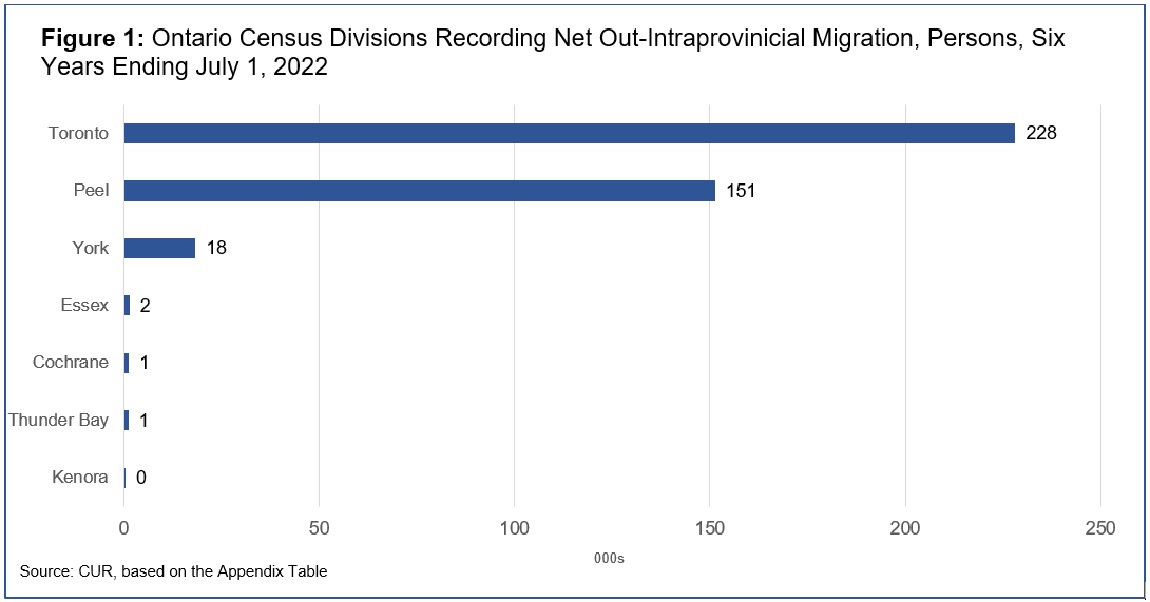
Toronto and Peel were by far the biggest losers of people to other census divisions, and the net outflows increased annually. For the past six years, Toronto lost 228,169, and Peel lost 151,282 residents. Five other census divisions lost residents but on a much smaller scale: York region in the GTA (18,355), Essex County (Windsor) (1,513), Cochrane in the north (1,279), Thunder Bay (1,157) and Kenora (439).
Three GTA census divisions – Toronto, Peel and York – had a net loss of 397,806 residents during the past six years.
Simcoe, Durham, and Niagara topped the 43 census divisions recording net inflows of intraprovincial migrants – the top ten net beneficiaries of intraprovincial migration accounted for 235,559 residents over six years.
Figure 2 presents the ten top census divisions recording the most significant net inflows of intraprovincial migrants.
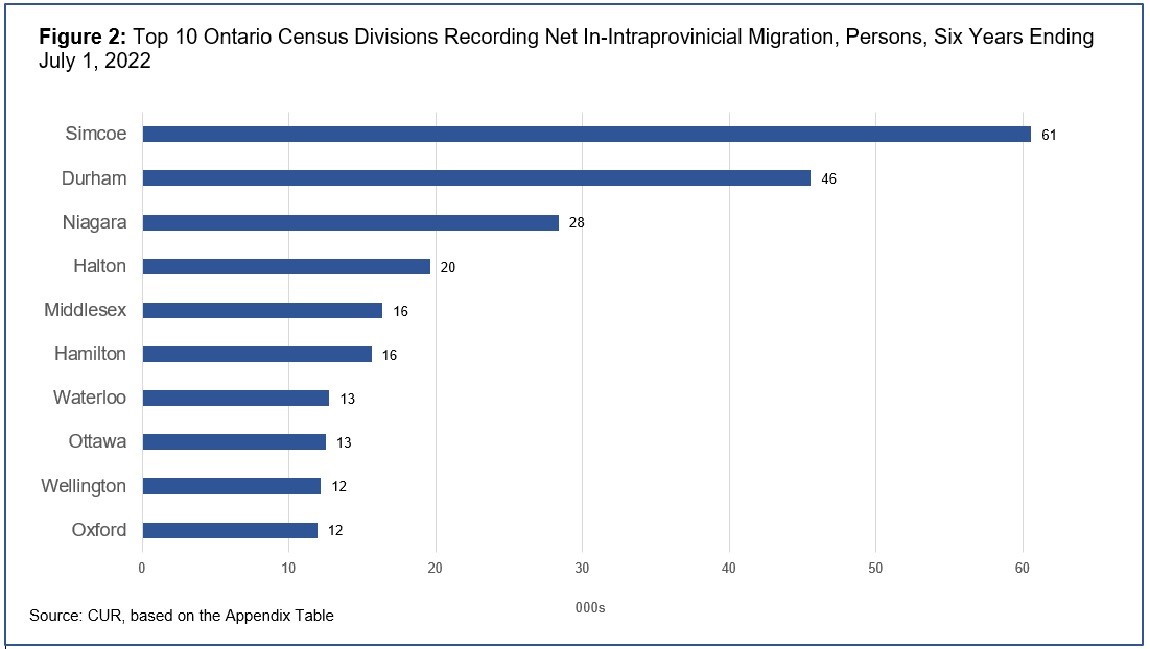
Simcoe (Barrie) and Durham received the most net migrants from elsewhere in the province over the latest six years. However, their net gains of 60,576 and 45,560 residents were modest compared to the net losses from Toronto and Peel.
Other parts of the GGH, also called the ‘outer fringe’, were net gainers of the GTA losses. Eight top census divisions recording net inflows were in the GGH. Only Ottawa and Oxford were outside the GGH.
The GTA experienced net losses over the past six years. However, the net gains in Durham (45,560) and Halton (19,629) fell far short of the net losses in Toronto, Peel and York.
The lack of affordable single-detached and semi-detached houses and missing middle housing options likely contribute to the GTA’s mounting net outflow of intraprovincial migrants
The worsening affordability of housing within the GTA, especially single-detached and semi-detached houses is an important reason for the rising GTA net migrant losses during the past six years. On the demand side, surveys conducted by Ipsos for the Toronto Regional Real Estate Board continually show that about 80% of all likely GTA homebuyers state they are most likely to purchase a ground-related home (55-60% a single-detached or semi-detached house). 2
On the supply side, however, the impact of policies in the Growth Plan for the Greater Golden Horseshoe of the provincial governments in power between 2003 and 2018 was to discourage the construction of single-detached and semi-detached houses on greenfield lands in favor of mid and high-rise apartments. In addition, no specific measures were introduced to promote the construction of missing middle housing forms like townhouses and stacked townhouses, which many families regard as closer substitutes to single- and semi-detached houses than mid and high-rise apartments.3
Governments can control the amount and type of housing built in specific municipalities. However, they cannot prevent people from moving elsewhere to search for the kind and price of housing they prefer.
Since 2018, the provincial government has been encouraging municipalities in the GGH to build more single-detached and semi-detached houses than previously, but the numbers are still below the level of underlying demand for these housing types. Paradoxically, municipalities, instead of beefing up the construction of missing middle housing types, are planning to replace the reduced production of single-detached and semi-detached houses with mid-and high-rise apartments.
The provincial government introduced measures in 2022 to increase housing production in the GTA and adjacent municipalities significantly, including aspirational targets municipalities are to adopt. Unfortunately, the targets are again in total units, which will undoubtedly result in many more apartments being built but a shortage of low and medium-density houses, townhouses, stacked townhouses and low-rise apartments.
The bottom line is that we anticipate the continued dispersal of the residents of the GTA, particularly those residing in Toronto, York, Peel and Halton, as they search for the type and price of housing they want elsewhere in the GGH and other parts of the province.
Sources
[1] Diana Petramala and Frank Clayton (2022). ‘Affordability Issues, Not the Pandemic, Drive Population from the City of Toronto and Peel Region.’ Centre for Urban Research and Land Development. [Online] Available: https://www.torontomu.ca/centre-urban-research-land-development/blog/blogentry62/
[2]Toronto Regional Real Estate Board (2023). ‘2023 Market Outlook & Year in Review.’ Jason Mercer and Sean Simpson, PowerPoint Presentation
[3] Frank Clayton (August 9, 2022). ‘GTHA 2021-2051 Land Needs Forecasts Lack Viable Alternatives to Single-Detached Houses.’ Centre for Urban Research and Land Development. [Online] Available: (PDF file) https://www.torontomu.ca/content/dam/centre-urban-research-land-development/CUR_Land_Needs_GGH_and_Missing_Middle_Aug.2022.pdf
Frank Clayton, Ph.D., is Senior Research Fellow at Toronto Metropolitan University’s Centre for Urban Research and Land Development (CUR) in Toronto.
Nigel Alphonso, is Research Assistant at Toronto Metropolitan University’s Centre for Urban Research and Land Development (CUR) in Toronto.
Appendix