You are now in the main content area
Meeting on data analysis and visualization: Part 2
- Date
- October 04, 2023
- Time
- 9:00 AM EDT - 10:30 AM EDT
- Location
- Via online (by invitation only)
Scope of the meeting:
Presentation of data models and analysis of first case studies; proposal of data visualization initiatives for the development of interactive tools
Data Models and Data Analysis: Ghana and Nigeria
The aim of the presentation is to illustrate the methodological approach and first results from the quantitative analysis for the West African Regional System, focusing on two case studies, Ghana and Nigeria. It is structured by section as follows:
- Methodological Approach: The analysis adopts a macro level approach to explore the main factors related to migration and establish comparability over time and across territories. The idea is to collect indicators, as proxies of the 5 macro-dimensions, economic, demographic, socio-cultural and environmental conditions.
- Data collection: variables harmonized at 25km2 from 1985 to 2014.
- Four data models are developed: the ordinary least squares regression, geographic weighted regression, multi-scale geographic weighted regression and geographically weighted random forest model.
- Results - Ghana: Exploring the nexus between migration and environmental factors over time across Ghanian territories, modeling results signal the most relevant variables/factors by period: i) in 2000-2004, maximum temperature and consecutive number of wet days; ii) in 2005-2009, precipitations, the length of consecutive wet days and gold mining activities; iii) in 2010-2014, the length of consecutive wet days.
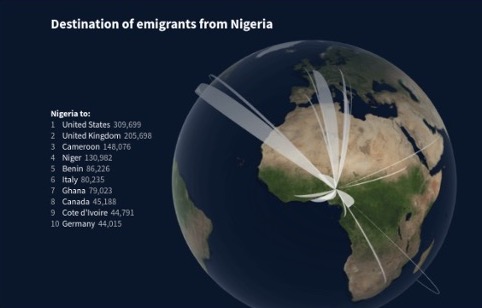
- Results - Nigeria: In a similar fashion to Ghana, model results are presented distinguishing multi-scale models. The minimum temperature and women with no education are identified as significant factors related to net-migration, showing restricted spatial variability and smaller-scale incidence. These results reveal possible signals of ‘trapped’ populations in the areas of Borno State, highly exposed to conflict fatality risks.
- Discussion: Clarifications on data comparability: models are carried out using the same core variables and adding variables to capture specific aspects that differ by country (for example how gold mining was included in Ghana and not Nigeria). Further factors such as political influence, government changes, border closures, and policy changes at national levels may be incorporated into models according to data availability at 25km2 and further developed. Multiscale models consistently detect more limited spatial variability across territories than the geographical weighted regression models
- Strengths: i) the data model capture the historical trends (30 years) ii) at granular level (25 km2); iii) ensuring comparability over time/across territories; iv) showing complementarity among the data methods. Limitations: i) macro approach, no indication of individual characteristics; ii) variables are referring to 5-year interval; iii) no distinction between in and out flows and between internal and international migration; iv) no causality - models reveal signals the of association between migration and contextual factors.
- Quantitative analysis does not capture causality; this is the objective of the qualitative analysis. Therefore, the results from the quantitative analysis will give insights to contextualize the areas that are more affected by specific factors, to design case studies for further research.
Developing Interactive Data Visualization Tools
- Data Visualization: a document titled Memo Map Style guide will be shared and distributed that consists of colour palettes and formatting suggestions to encourage best practices.
- Story Map: Additional MEMO visualization outputs will explore possible Story Map tools, as an interactive approach to summarizing migration data.
- Collaborative experience: A survey will be addressed to co-applicants to assess data visualization needs and experiences. Not all partners hold the same level of visualization experience, and this should be taken into account when developing visualization tools to increase accessibility.
- Dashboard alternative: Three prototype interactive dashboards are illustrated. All dashboards build off ArcGIS Online capabilities with some advantages and limitations, and with functionality that can be tailored for researcher needs. Research experience can be utilized to define how the collaborative experience can be developed, as a web browser product, in groups or other dissemination methods, or refined in an iterative process. Other interactive visualizations have been developed for Nigeria with maps and moving graphs.
- Future work will continue to harmonize visualization tools with data analysis models and integrate components into larger room scale visualization tools for the end of 2024.
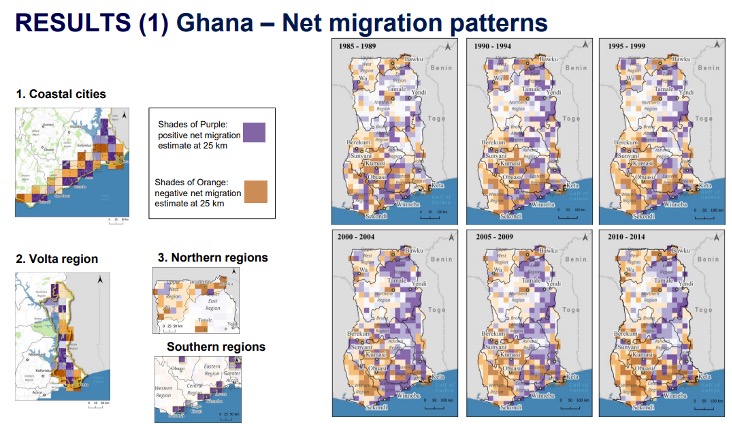
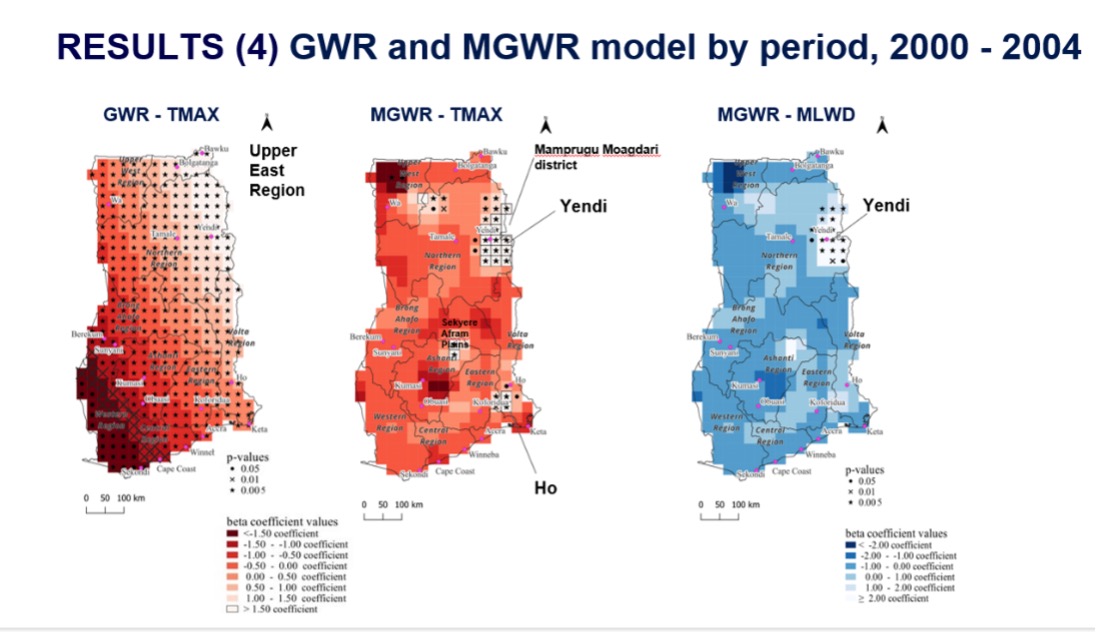
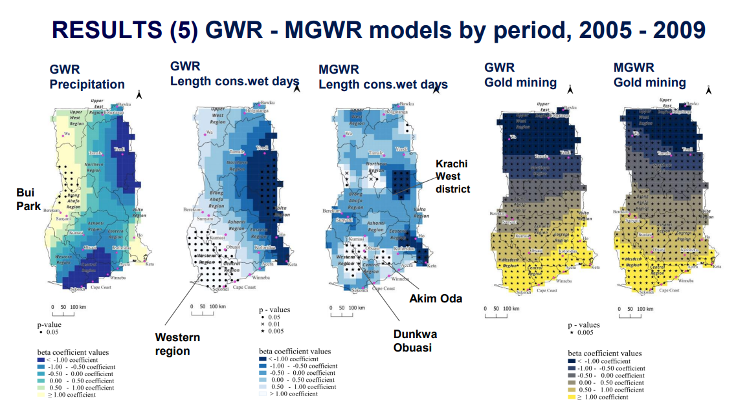
Sarah Hoyos-Hoyos and Daniela Ghio presented data for Ghana, in the Regional System of West Africa. Sample Results (1) include mapped migration patterns, and modeling results for different time periods Results(4) and Results (5).
Slides from Gabby Resch's visualization presentation.