How does population density in the GTHA compare with other larger urban regions?
By: Cameron Macdonald, B.A., 4th Year Student in Urban and Regional Planning, Toronto Metropolitan University, and Researcher at the Centre for Urban Research and Land Development
November 28, 2016
Background
The Ontario government and its advisors clearly feel the current population density (average population per km of built-up area) in the Greater Golden Horseshoe (GGH) is too low. Otherwise they would not have imposed the minimum intensification/density targets they did in the 2006 Growth Plan and would not be proposing an increase to these minimums in the updated 2016 Growth Plan.
This raises the question: what urban density is desirable in the GGH taking into account a range of economic, housing/real estate market, social and environment considerations and concerns in a balanced way?
This blog post takes a small step in forwarding the optimal urban density discussion by comparing urban densities in the Toronto-based region to other larger regions in Canada and elsewhere in the world:
- First, it presents urban densities for the GTHA and its three component census metropolitan areas (CMAs)1 based on Statistics Canada data for the year 20112;
- Second, it compares urban densities in the Toronto CMA with other large CMAs in Canada; and
- Third, it compares urban density in the GTAH with competitive global metropolitan regions3, as calculated by Demographia4 for the year 2016.
GTHA Population Densities in 2011 and 20165
Statistics Canada, in their report, measured average population density by individual CMA. Demographia combines the Toronto, Oshawa and Hamilton CMAs to create what it calls the Toronto region. This includes the Toronto, Hamilton and Oshawa CMAs.
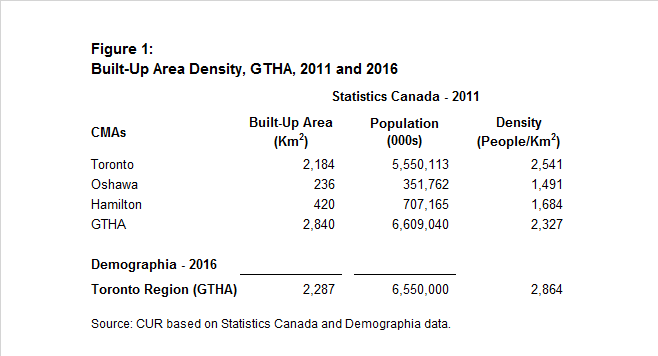
The GTHA’s built-up area population density, as estimated by Demographia in 2016, is over 25% higher than the 2,541 people/km2 reported by Statistics Canada in 2011. Demographia’s calculation of the size of the built-up area is considerably smaller and its 2016 population is the same as what had been reported by Statistics Canada in 2011. Reasons for the discrepancies are not obvious though we are inclined to opt for the Statistics Canada’s estimates as being the most reliable source of Canadian urban density data.
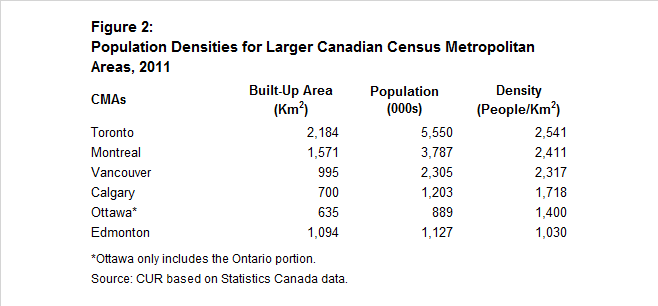
How Does Toronto Compare to Other Large Canadian Metropolitan Areas?
Statistics Canada data shows that the Toronto CMA is the most dense in terms of people living in the built-up area, surpassing Montreal sometime between 2001 and 2011. Its average population density of 2,541 persons per km2 of built-up area was modestly higher than Montreal or Vancouver – Calgary, Ottawa (Ontario portion) and Edmonton had noticeably lower densities in 2011.
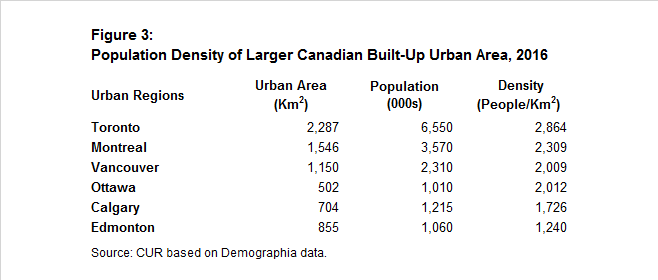
The 2016 Demographia density data for the same Canadian urban regions shows quite different results. While Toronto, Montreal and Vancouver remain the highest density, the gap between them has increased. Toronto is denser than Statistics Canada estimated, whereas Montreal and Vancouver are less dense. The remaining three regions – Calgary, Edmonton and Ottawa– have seen their order altered. Ottawa is now the densest of these three cities with a significant increase in density over that shown by Statistics Canada. Edmonton also shows a higher density than estimated by Statistics Canada.
How Does Toronto Compare to Competitive Metropolitan Areas – Global Urban Built-Up Areas?
Using Demographia’s data projections from 2016, we compare Toronto to what the Toronto Region Board of Trade has ranked the top 13 global cities in terms of productivity and global competitiveness. Not only is the Toronto region the densest of all Canadian urban regions, it is also considerably denser than the competitive American urban regions, including San Francisco and New York.
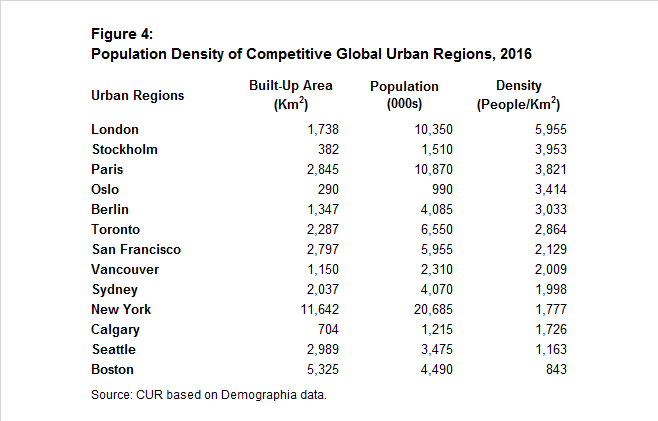
While Toronto ranks as the densest of competitive North American regions, it lags behind competitive European regions, especially London. It is however, reasonably close to Berlin in terms of population density of its built-up urban area.
(1) We have aggregated the Toronto, Oshawa and Hamilton CMAs to approximate data for the entire GTAH region.
(2) Statistics Canada (2016). The changing landscape of Canadian Metropolitan Areas. Retrieved from (PDF file) http://www.statcan.gc.ca/pub/16-201-x/16-201-x2016000-eng.pdf
(3) Toronto’s top 13 competitive global regions as ranked by the Toronto Region Board of Trade. (2015). Toronto as a Global City: Scorecard on Prosperity – 2015. Retrieved from: (PDF file) https://www.bot.com/portals/0/unsecure/advocacy/Scorecard_2015.pdf
(4) Demographia (2016). Demographia World Urban Areas. Retrieved from (PDF file) http://www.demographia.com/db-worldua.pdf (external link)
(5) For our analysis we are combining what Statistics Canada calls the settlement area and roads to determine the total built-up area. While Statistics Canada measures population density in terms of settlement area, our view is that using total built-up area as the denominator of the density ratio gives a more accurate measure.