Study Ranks 23 GGH Municipalities According to the Restrictiveness of Their Residential Land-Use Regulation

By: Cameron Macdonald, B.A., 4th Year Student in Urban and Regional Planning, Toronto Metropolitan University, and Researcher at the Centre for Urban Research and Land Development
September 23, 2016
The Fraser Institute recently released a cross-Canada study that empirically examines the relationship between municipal land use regulation and the supply of new housing.(1)
There are two components of the research undertaken by the Fraser Institute which should be of interest for those involved in land use planning and urban policy in the Greater Golden Horseshoe (GGH):
- The creation of a framework for empirically measuring land use regulation in municipalities in terms of its impact on the supply of new housing in individual municipalities; and
- The collection and manipulation of information from a survey of developers and homebuilders which is used to compile an index of residential land-use regulation for each of 23 municipalities located in the GGH.
This blog post presents the survey-based measures of regulation for each of five individual regulation measures and a composite index of residential land use regulation for 23 municipalities within the GGH, as calculated in the Frazer Institute study.(2)
This is the first time I have seen a comparison of the residential land-use regulation systems by municipality within the GGH. Undoubtedly, there will be disagreement with the categorization of individual municipalities. This would not be surprising since the Fraser Institute’s survey included just 58 homebuilders and developers who each on average answered questions for 8.1 municipalities. Only municipalities with 3 or more responses are excluded. The analysis covers 23 municipalities.
The Fraser Institute’s research represents a starting point for a more fulsome categorization of municipalities within the GGH according to the restrictiveness of their land use regulation for the production of new housing.
Description of the Framework for the Calculation of Residential Land Use Regulation in Municipalities
The Fraser Institute’s composite index of residential land-use regulation is based on what the Fraser Institute identified as five factors (attributes) of planning regulation: approval timelines, council and community opposition, ‘costs and fees,’ timeline uncertainty; and the prevalence of rezoning. Each of these five factors is detailed in Figure 1.
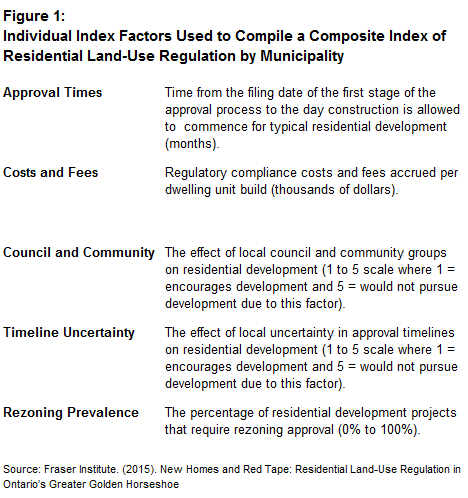
A composite index of residential land-use regulation is computed by municipality using the individual index factors as source information. The index is negative in municipalities that are less regulated than average and positive in the more regulated municipalities.
Ranking of the 23 GGH Municipalities Examined
Figure 2 contains the ranking of municipalities where #1 applies to the municipality with the least regulated in terms of new housing production to #23 for the most regulated municipality.
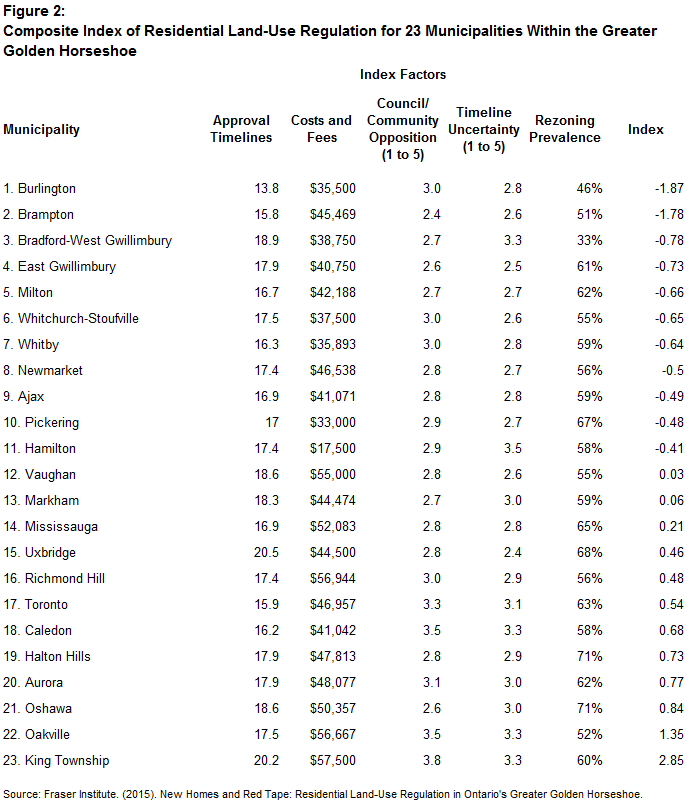
Municipalities are listed according to their restrictiveness of their residential land use regulatory systems with:
- The #1 ranking being the least restrictive planning system (the smallest negative impact on new housing supply of all 23 municipalities) as indicated by a negative composite index value of –1.87;
- The average of all municipalities is a zero value; and
- At the other extreme, the #23 ranking is the most restrictive municipal planning system (largest negative impact on new housing supply) as indicated by a positive value of 2.85.
According to the Fraser Institute’s study, the 5 municipalities in the GGH where residential land use regulation in terms of impact on new housing supply is least negative are (the rankings are from Figure 2):
#1 Burlington
#2 Brampton
#3 Bradford–West Gwillimbury
#4 East Gwillimbury
#5 Milton
The 5 municipalities where residential land use regulation is most negative for the supply of new housing are (the rankings are from Figure 2):
#23 King Township
#22 Oakville
#21 Oshawa
#20 Aurora
#19 Halton Hills
Here is the Fraser Institute’s study assessment of why Burlington ranks tops the index of residential land-use regulation and King Township ranks the lowest:
“Of the GGH cities ranked, Burlington tops the Index of Residential Land-Use Regulation. This is driven by good ratings on timeline length, regulatory costs, and rezoning, and despite a relatively strong, negative impact from council and community. Oakville – Burlington’s neighbour – stands in contrast to Burlington’s relatively efficient and low-cost regulations, ranking worse on all indicators. King Township ranked the lowest, as it scored poorly on all measures except for the prevalence of rezoning.”
We at CUR would like our blog readers to supply their assessment of the regulations framework in Figure 1 and whether they agree or not with the individual municipal ranking in Figure 2. Do you accept the Fraser Institute’s study’s findings? If not, why?
Send your response to Laura Greflund at cur@torontomu.ca.
(1) Fraser Institute. (July 2016). The Impact of Land-Use Regulation on Housing Supply in Canada. https://www.fraserinstitute.org/studies/impact-of-land-use-regulation-on-housing-supply-in-canada (external link)
(2) Fraser Institute. (October 2015). New Homes and Red Tape: Residential Land-Use Regulation in Ontario’s Greater Golden Horseshoe.