Surge in Ground-Related Lot Values Reflects a Shortage of Supply in the GTA
August 19, 2016
Many believe that the Province of Ontario’s Growth Plan has designated sufficient greenfield lands in the 905 portions of the Greater Toronto Area (GTA) to more than accommodate the demands for new housing up to the year 2031 and beyond. In this vein, it follows that land shortages could not possibly be a cause of surging prices for single-detached houses in the GTA given this more than ample supply of vacant designated lands.
I do not know whether or not there is an ample supply of land designated for new housing to meet the demands of the marketplace up to 2031 and beyond. What I do know is there is substantial evidence that indicates a severe shortage of serviced lots on which to construct new single-detached houses, semi-detached houses and townhouses (ground-related housing) in the GTA. Lands designated, but without subdivision registration or draft plan approval by the municipality, cannot be readily serviced with infrastructure like sewer and water, which are prerequisites for new residential construction.
Our blog entry on July 15th detailed the increasing gap between the rising demand for ground-related housing, as measured by MLS sales of existing homes, and the downward trend in ground-related housing starts in the GTA over the past decade. I blame the lack of serviced lots for this unresponsiveness.
This entry examines another indicator of a shortage of serviced lots for new single-detached houses and other ground-related housing in the GTA: the behaviour of serviced lot prices since 2005.
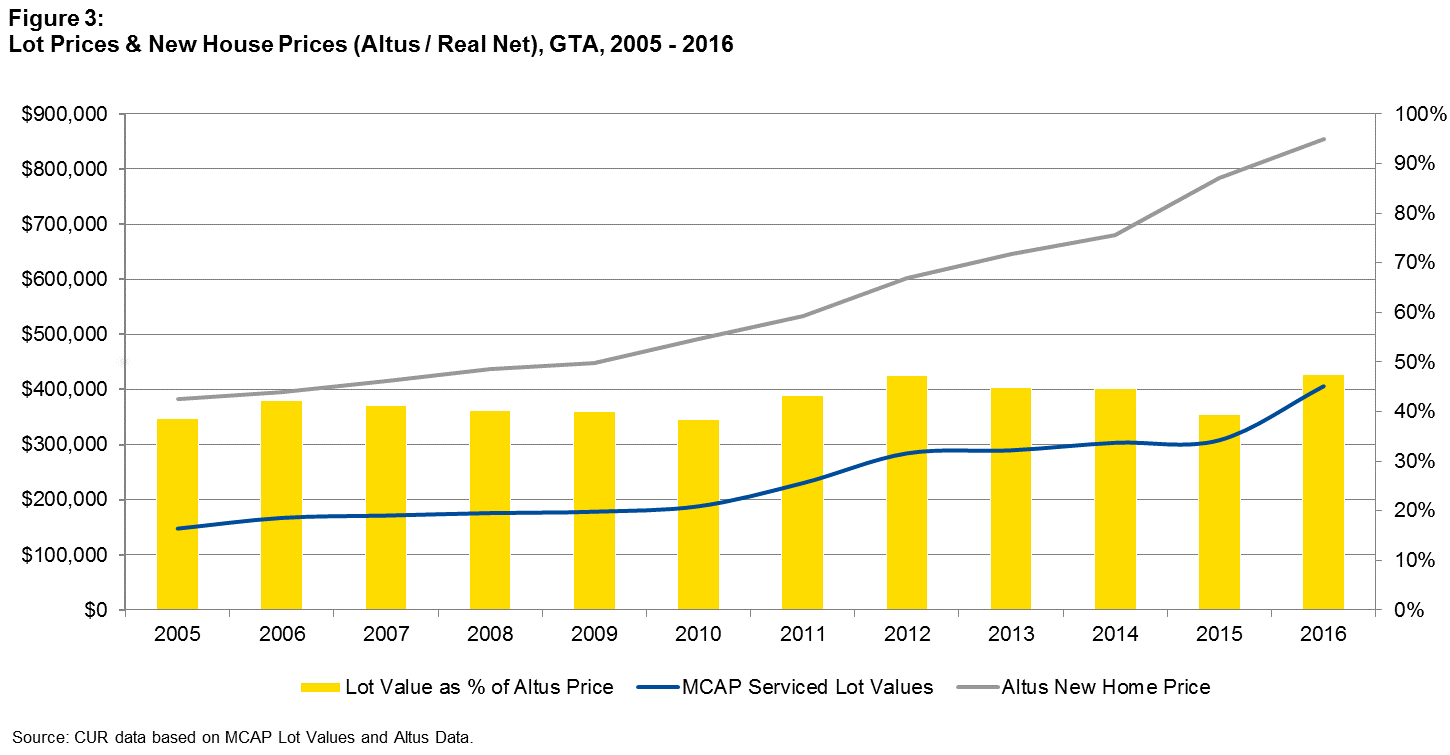
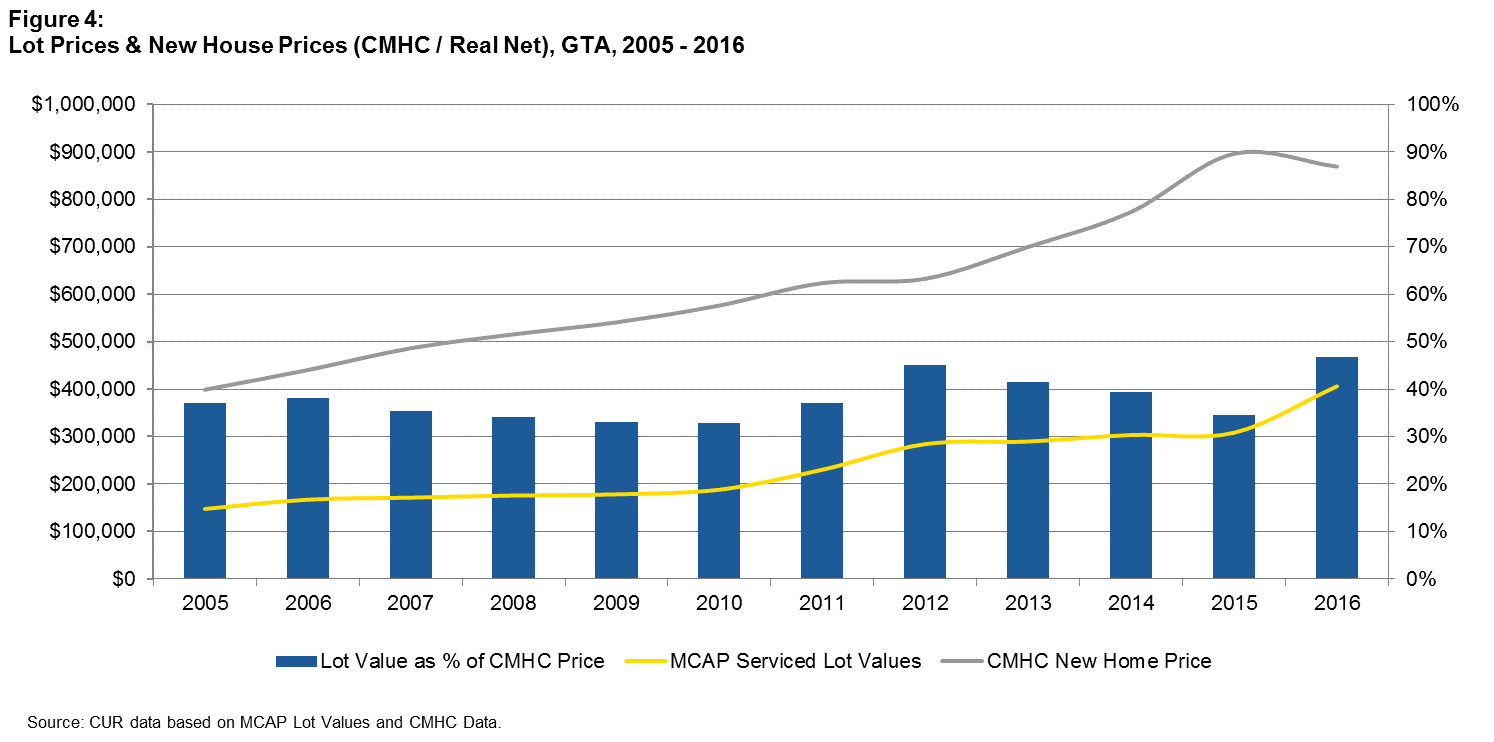
Our analysis documents that values of serviced lots are currently very high, exceeding $400,000 for a 40 foot lot in the GTA, with Markham recording the extraordinary average price of just over $800,000 for a single lot. On average, the value of a lot (40 front feet) is equivalent to about 45% of the end price of a new house in the GTA. Since 2005, average lot values have risen at a somewhat quicker rate than average house prices.
MCAP is the Source of Data on Serviced lot Values in the GTA
Toronto-based MCAP, one of Canada’s largest independent mortgage financing companies, has released a semi-annual report on lot values for ground-related housing lots in several municipalities within the GTA dating back to 2005. MCAP refers to its estimates as “lot values” rather than “lot prices” since they are based upon a residual land value analysis and not on lot sales or appraisals.1 The lots are fully serviced with development charges paid.
Average Serviced Lot Values in the GTA as a Whole
Values per Front Foot
Figure 1 presents average lot values in the GTA for alternative lot sizes as of June 2016 starting with the year 2005. The lot values are expressed in terms of value per front foot, which is how developers and homebuilders typically price lots.
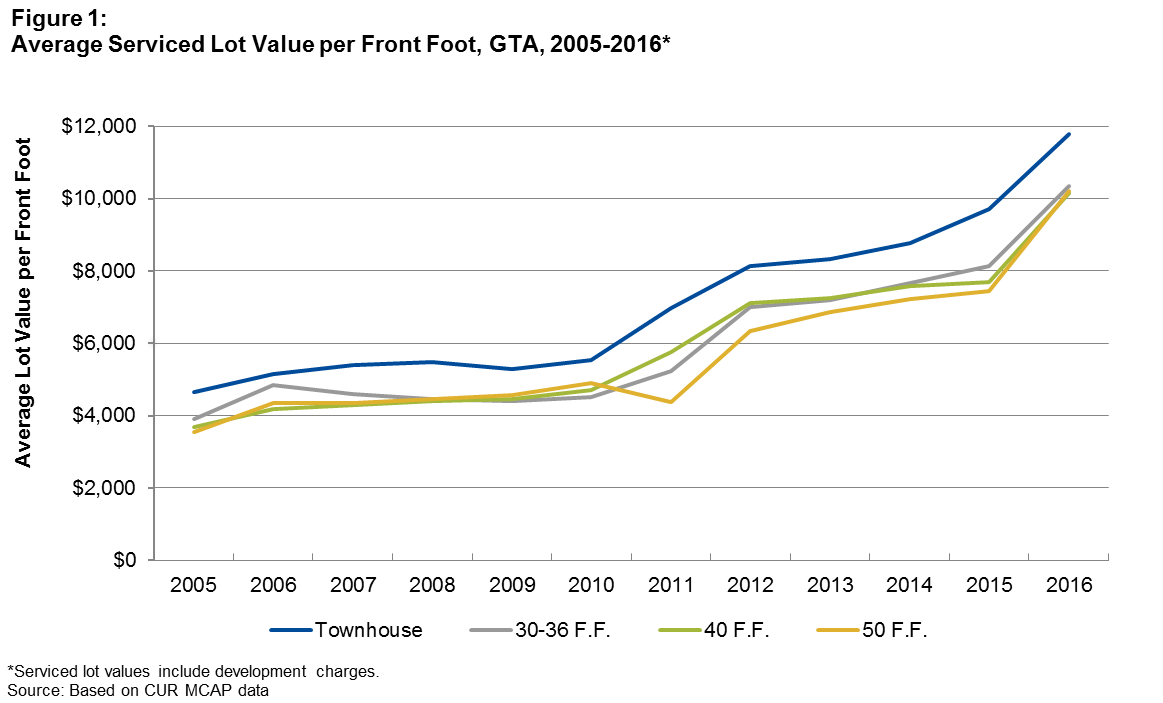
On a front footage basis, average lot values are highest for townhouses at $11,775 per front foot and lowest for 40-foot single-detached lots at $10,150 per front foot. The average values per front foot for all three single-detached categories of lot sizes (30-36 front feet, 40 front feet and 50 front feet) were similar.
Increases in Value Since 2005
Average lot values were markedly higher in June 2016 than 11 years early with much of the increase occurring after 2010. Between 2005 and June of 2016 the percent increase in lot values ranged between 153% and 187%:
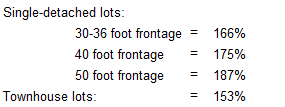
Overall inflation, as measured by the Consumer Price Index for the GTA, climbed by just 23% during this period.
Total Values
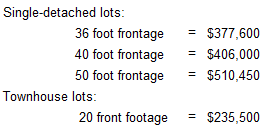
Prospective homebuyers care mainly about the total value of serviced lots since these costs are most important to the end prices of new houses. In June 2016, average values for serviced single-detached lots in the GTA varied between $372,600 for an average 36 front foot lot to $510,450 for a 50-foot lot. For an average townhouse lot with 20-foot front, the average price was $235,500.
These values are for serviced lots including development charges – they exclude any of the building costs, such as labour, materials, so-called soft costs incurred by builders, and a risk-adjusted profit margin.
Average Serviced Lot Values in Selected Municipalities
The average value of serviced lots as at June 2016 varies widely amongst municipalities (see Figure 2).
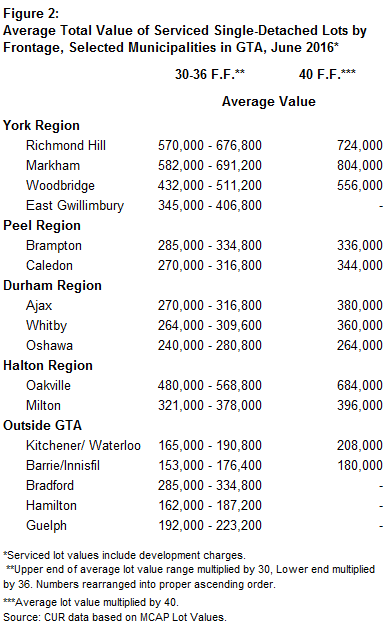
Looking at average total values of single-detached lots with 40 foot frontage:
- Four municipalities had average total lot Values far in excess of the GTA-wide average value of $406,000:
- Markham = $804,000
- Richmond Hill = $724,000
- Oakville = $684,000
- Woodbridge = $556,000
- The lowest average total lot values were found in three municipalities:
- Oshawa = $264,000
- Brampton = $336,000
- Caledon = $344,000
Comparison of Serviced Lot Values and New House Prices
The Data Series
The average serviced lot values for the GTA and their increases since 2005 are compared to the average prices of new houses in Figure 3 and 4. Serviced lot prices are represented by the average value of lots having 40-foot frontages.
Two available price series for new houses are considered:
- Altus Group/RealNet’s average asking prices for houses in new low-rise housing projects being marketed (“low-rise homes” is synonymous with our term “ground-related homes”); and
- CMHC’s average prices of absorbed single- and semi-detached houses (an absorbed home is a housing unit that has been sold and completed).
A comparison of Figure 3 and 4 indicates that the performance of new house prices in the two price series is fairly comparable both in levels and increases since 2005. An exception is CMHC’s average price in the first half of 2016 which declined from 2015. This likely reflected a change in the mix of houses absorbed rather than an actual decline in prices.
The Comparisons
Both comparisons show very similar patterns:
- The average value of a serviced lot (with 40 front feet) was equivalent to 42%-45% of the end price of new houses in the first half of this year.
- This was marginally higher than the proportions back in the mid 2000s.
Bottom Line
The behaviour of lot prices over the years since 2005 is consistent with a growing shortage of serviced lots for homebuilders to build ground-related types of housing in the GTA.
(1) Email from Bruno Iacovetta, Managing Director, MCAP dated August 5, 2016. A residual land value analysis starts with the end house price for the lot and house combined and backs out Harmonized Sales Tax, industry averages for hard and soft costs and a reasonable profit margin to generate raw value of a fully serviced lot with development charges paid.