Greater Golden Horseshoe Housing Supply: Several Oddities When Comparing CMHC and Census of Canada Data
By: Frank Clayton with assistance from Nigel Alphonso
May 24, 2022
(PDF file) Print-friendly version available
This blog compares two housing supply data sets during the past five-year census period (June 2016 to May 2021). These are additions to the housing stock (completions and net conversions) as counted by CMHC and additions to the housing stock as reported in the Census of Canada (growth in total dwellings).1 The focus is on the Greater Golden Horseshoe (GGH) and the Greater Toronto and Hamilton Area (GTHA).
Housing completions plus net conversions within the existing housing stock and the change in total private households should be the same if the data are accurate and complete.
However, there are several anomalies:
By Census Metropolitan Area (CMA) within the GGH:
- The new supply represented by CMHC's completions and net conversions in Toronto exceeded the change in total dwellings counted in the Census of Canada between mid-2016 and mid-2021 by almost 16,999 dwelling units, or 11%:
- Similarly, in Guelph and Peterborough, the CMHC supply exceeded increases in total dwellings by 27 and 8 percentage points, respectively; and
- Contrarily, in Brantford and Hamilton, CMHC's data on housing supply fell short of the growth in total private dwellings by 15 and 10 percentage points, respectively
By upper-tier and single-tier municipalities within the GTHA:
- The excess CMHC supply was centred in Peel (10,965 units), Toronto (3,937) and Halton (2,524);
- The excess CMHC supply in Peel was mainly in net conversions due to a vast number of secondary suites being created in Brampton. The Census of Canada data now suggest that these numbers for Brampton did not represent the creation of new secondary suites but the legalization of ones already there; and
- The growth in private dwelling units in Hamilton counted in the Census of Canada exceeded the CMHC number but about 15%.
Relatively little is known about changes within the housing stock. Since there is a potential for an enlarged supply of additional housing to be created within the existing housing stock, better monitoring and understanding of the dynamics of changes in the current housing stock is a priority. Hopefully, the provisions of Ontario’s More Homes for Everyone Act 2022 will provide funding for this data collection and research.
Short description of two housing supply growth data sets
Housing analysts typically compare CMHC's housing completions (new housing supply) and household growth (net additional housing demand) from the Census of Canada to judge the completeness of these data sources. Household growth is also a supply measure; by definition, a household is one or more persons occupying a dwelling unit.
However, neither data set fully portrays changes in the housing stock. Completions do not include net additions to the housing stock from sources other than new construction (net conversions). Changes in occupied dwellings can reflect changes in vacant units as well as additions to the total housing stock
A brief description of each data set follows. More details are provided in the technical note at the end of this note.
- CMHC: Additions to the housing stock equals completions plus additions from within the existing housing stock and conversions of non-residential buildings like offices, warehousing and schools, minus losses to the current housing stock through demolitions, fires and deconversions.
- Census of Canada: Total private dwelling units equals private dwellings occupied by usual residents, including landed immigrants, and private homes occupied by foreign residents or other temporary residents.
The housing supply data sets are presented in two ways geographically:
- Housing market areas in the GGH – summing the nine census metropolitan areas (CMAs) within the GGH
CMAs represent housing market areas. Unlike municipal boundaries, they are based on where people live and work. For example, the CMA centred on the city of Toronto dominates the GGH housing market area.
- Municipal entities within the Greater Toronto and Hamilton Area (GTHA) – summing the census divisions with the GTHA
Municipal boundaries are determined politically. The GTHA encompasses the four so-called 905 regions (upper-tier regional municipalities) and the cities of Toronto and Hamilton (single-tier municipalities). These six municipalities coincide with what Statistics Canada refers to as census divisions.
The detailed data sets for the GGH and the GTHA from CMHC and the Census of Canada are contained in Figures 1 and 3.2 Figures 2 and 4 analyze new housing supply as counted by CMHC (completions and net conversions) as a percentage of the growth in total private dwellings from mid-2016 to mid-2021.3
Comparison of GGH housing supply growth 2016-2021: CMHC and the Census of Canada
Figure 1 compares CMHC housing supply growth (housing completions and net conversions) to the increase in total private dwellings for the nine CMAs forming part of the GGH. All references in the text using municipal names refer to the CMA and not to a particular municipality (e.g., Toronto = Toronto CMA).
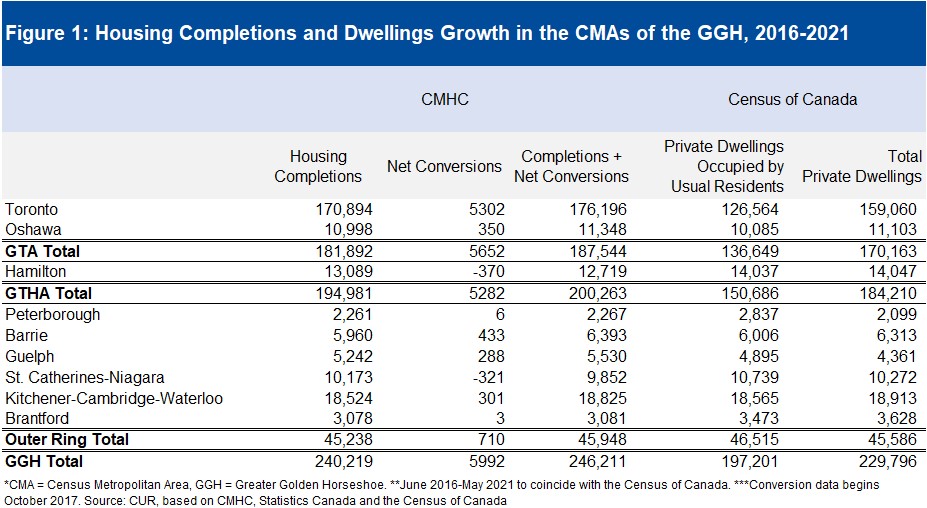
Highlights include:
- Completions account for almost all new housing supply in the GGH according to CMHC – net conversions are negligible
Except for Toronto, net conversions are a negligible source of additional housing in the GGH, accounting for just 2% of the total new supply between 2016 and 2021. The proportion is highest for Toronto at 2.6%, which is still small. In absolute numbers, Toronto reported net conversions of 5,202 units, which was 88% of the GGH total.
- Growth in GGH total dwellings outpaces new supply by almost 16,000 homes according to CMHC, with all the difference located in Toronto
With the current tightness in both the ownership and rental markets, it is surprising that combined housing completions and net conversions outpaced the increase in total dwellings in Toronto by almost 16,000 homes over the five years ending in mid-2021. New supply as counted by the CMHC matched dwelling growth for the six CMAs of the GGH outside of Toronto combined (the Outer Ring).
- Brantford, Hamilton, Guelph, and Peterborough are outliers in percentage terms
While Toronto has the most significant absolute gap between the two supply data sets, four other CMAs also had sizeable gaps in percentage terms (+/- 8%).
Brantford and Hamilton are distinctive, with CMHC's data on housing supply falling short of the growth in total private dwellings by 15 and 10 percentage points, respectively (see Figure 2). The opposite was the case for Guelph and Peterborough, with CMHC supply exceeding increases in total dwellings by 27 and 8 percentage points, respectively.
The reasons for these differences need to be explored. However, they likely reflect a combination of data deficiencies and housing market differences.

Comparison of GTHA housing supply growth 2016-2021: CMHC and Census of Canada
Using the same data as in Figure 1, Figure 3 shifts the focus from the GGH to the GTHA and its four 905 regions and two single-tier cities. In addition, the municipal names now refer to the municipalities of the same name.
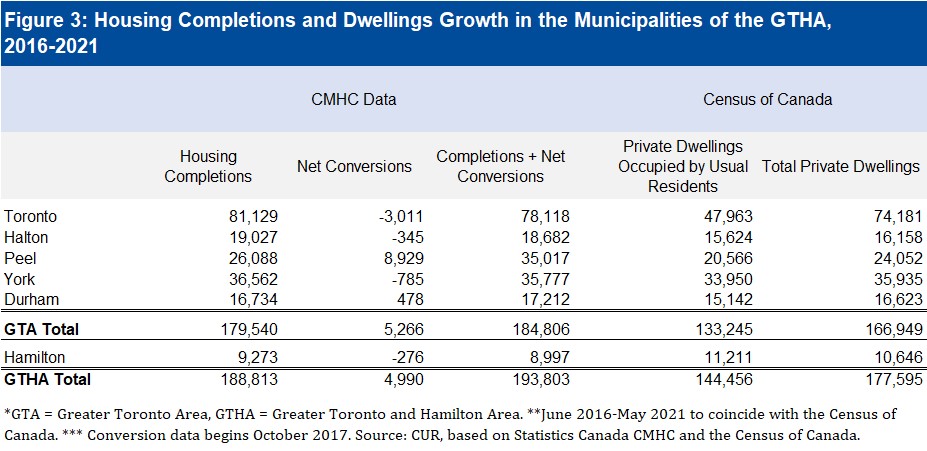
Highlights include:
- New housing supply created through net conversions is centred in Peel – the City of Toronto experienced net conversion losses
From October 2017 to May 2021, Peel dominated housing supply created through net conversions with 8,230 new dwelling units. This apparent uptick in supply more than countered the combined net conversion losses experienced by the City of Toronto, York Region and the City of Hamilton (almost 4,000 units in total).
In a CUR blog dealing with net conversions within the Toronto CMA, we noted that the City of Brampton accounts for almost all the housing supply created through net conversions.4
- The Peel comparison casts doubts on the accuracy of the City of Brampton's building permit data for secondary suites
During the five years examined, the CMHC count of housing supply (completions and net conversions) for Peel Region exceeded the increase in private dwellings as counted by the Census of Canada by more than 10,000 units or 43%. Most of the difference represents net conversions.
It strongly suggests that Brampton's building permit data for secondary suites represent the legalization of existing secondary suites and not additions to the existing housing stock.
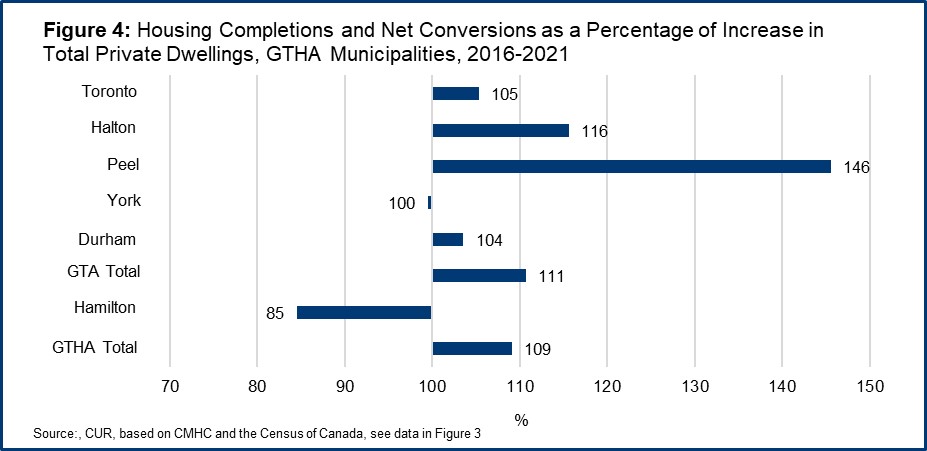
- CMHC's new housing supply is higher than dwelling growth in all GTHA municipalities except York and Hamilton
The CMHC housing supply count between mid-2016 and mid-2021 exceeded total dwelling unit growth in four of the six municipalities examined. Excluding Peel, CMHC housing supply exceeded dwelling growth by 6% in Toronto to 16% in Halton. The difference went the other way in Hamilton's case, with CMHC's housing supply falling short of the Census of Canada figure.
Again, we do not know how these differences reflect data disparities or variations in housing market fundamentals.
Conclusion
For many GGH municipalities, data from CMHC and the Census of Canada produce similar results regarding growth in the supply of dwelling units. However, for a few municipalities, there are worrisome differences in the data. Further research should be undertaken to explore the reasons for these differences and recommend actions to rectify them.
Relatively little is known about changes within the housing stock. CMHC's net conversion data is based on building permit statistics from Statistics Canada, which cover only a portion of the changes. Since there is a potential for an enlarged supply of additional housing being created within the existing housing stock, better monitoring and an understanding of the dynamics of changes in the existing housing stock is a priority.
Understanding the data on actual additions to housing supply is the endpoint of the continuum to ensure that there is an adequate supply of new housing. As CUR has previously argued, due to the extended period necessary to provide additional housing supply, it is also necessary to have reliable data about land at various stages of the approval process.5 It is thus important to ensure the collection of better and more accurate data on completions and to ensure that municipalities collect and provide data on the supply of serviced and approved land by housing type they are required to maintain under the Provincial Policy Statement (Policy 1.4.1).6 This will provide a complete set of data on housing supply for policy makers, planners and developers to make better decisions about the need and provision of new housing.
Hopefully, the provisions of Ontario’s More Homes for Everyone Act 2022 will provide funding for this data collection and research.
Sources:
[1] CMHC net conversion estimates cover the period from October 2017 to May 2021.
[2] For the detailed data sets, see CMHC (2022). “CMHC Residential Conversions and Demolitions Statistics.” [Online] Available: https://www.cmhc-schl.gc.ca/en/professionals/housing-markets-data-and-research/housing-data/data-tables/housing-market-data/residential-conversions-demolitions-statistics (external link) ; CMHC (2021). “Housing Information Monthly.” [Online] Available: https://www.cmhc-schl.gc.ca/chic/Listing?item_ID=%7B53A57B68-6755-4C6E-A564-8B4A53122A5B%7D; Statistics Canada (2017). “Census Profile. 2016 Census. Statistics Canada Catalogue no. 98-316-X2016001.” [Online] Available: https://www12.statcan.gc.ca/census-recensement/2016/dp-pd/prof/index.cfm?Lang=E (external link) ; and Statistics Canada (2022). “Census Profile. 2021 Census. Statistics Canada Catalogue number 98-316-X2021001.” [Online] Available: https://www12.statcan.gc.ca/census-recensement/2021/dp-pd/prof/index.cfm?Lang=E (external link) .
[3] Data on growth in private households occupied by usual residents are included if the reader wants to compare occupied dwelling and total dwelling growth.
[4] Diana Petramala and Ryan Kyle (2022). “Brampton: The Land of Secondary Suites.” The Centre for Urban Research and Land Development. [Online] Available: https://www.torontomu.ca/centre-urban-research-land-development/blog/blogentry61/.
[5] Centre for Urban Research and Land Development (2019). “CUR Submission Regarding Proposed Changes to the Provincial Policy Statement: Submission to the Provincial Planning Policy Branch at the Ministry of Municipal Affairs and Housing.” [Online] Available: (PDF file) https://www.torontomu.ca/content/dam/centre-urban-research-land-development/pdfs/CUR_Submission_Re_PPS_Revisions.pdf.
[6] Policy 1.4.1 of the Provincial Policy Statement requires municipalities to maintain a three-year supply of serviced/approved land by housing type. They are also required to report this inventory annually to the Province. Ontario (2020). “Provincial Policy Statement, 2020.” [Online] Available: https://files.ontario.ca/mmah-provincial-policy-statement-2020-accessible-final-en-2020-02-14.pdf#:~:text=The%20Provincial%20Policy%20Statement%20provides%20policy%20direction%20on,for%20regulating%20the%20development%20and%20use%20of%20land, 16. In reality, few municipalities adhere to this regulation.
Frank Clayton, Ph.D., is Senior Research Fellow at Toronto Metropolitan University’s Centre for Urban Research and Land Development (CUR) in Toronto.
Assistance provided by Nigel Alphonso, Research Assistant at Toronto Metropolitan University's Centre for Urban Research and Land Development (CUR) in Toronto.
![]()
Technical Note: Two Housing Supply Data Sets
CMHC: Completions encompass dwelling units defined as a structurally separate set of self-contained living premises with a private entrance outside the building, or a common hall, lobby, or stairway inside the building. Excluded are units created through conversions and/or alterations within existing structures, seasonal dwellings such as cottages not intended for year-round occupancy, hostel accommodation such as hospitals and nursing homes and collective dwellings such as hotels and lodging homes. There are also losses to the existing housing stock through demolitions and removal of suites in existing residential buildings.
Starting in October 2017, CMHC collects data on dwelling units demolished and dwelling units created or lost through conversions (new dwelling units) or deconversions (loss of existing dwelling units) within existing residential and non-residential buildings. This data series is derived from municipal building permit data collected by Statistics Canada, though not all conversions or deconversions have building permits. For example, secondary suites added to single-detached houses illegally.
Census of Canada: The definition of a private dwelling unit is comparable to CMHCs. Collective dwellings are excluded. In addition to permanent residents and landed immigrants, usual residents include refugee claimants, persons from another country with a work or study permit and any family members living with them. Seasonal cottages not suitable for year-round living are not considered dwelling units. Dwellings listed as unoccupied or unoccupied by usual residents are also included in total private dwelling units. These include vacant homes and dwellings occupied by foreign residents or temporarily present persons - people whose primary residence is elsewhere. Students make up a sizable constituency of such persons. Newly completed homes not yet occupied are also considered vacant.