Metro Toronto Population Growth Crashes to 21st Place in U.S./Canada Ranking, Down from Third Place in 2020
By: Frank Clayton and Ryan Kyle
April 18, 2022
(PDF file) Print-friendly version available
The United States Census Bureau recently released new population estimates for U.S. metropolitan areas. These population estimates are for July 1, 2021, and are comparable to the annual estimates for Canadian metropolitan areas released by Statistics Canada in January.
This blog compares population growth in metropolitan areas in Canada with those south of the border in the 12 months ending July 1, 2021.1 We shorten the full names of metropolitan areas in the text for brevity.
These estimates show Toronto plummeted from its previous position in third place in 2020 to 21st overall. While it remained the top metropolitan area for net international migration, the overall pandemic-inspired drop in immigration levels and a larger net loss in domestic migration resulted in Toronto’s tumble. However, it should regain its position as one of the fastest-growing metro areas in the U.S. and Canada in the coming years as immigration resumes post-pandemic and if domestic out-migration does not accelerate.
All ten fastest-growing metro areas in 2021 are in the U.S. – Vancouver is in the 11th spot
Figure 1 shows that in 2021, Dallas (+97,000) and Phoenix (+78,000) again topped the list, followed by Houston (+69,000) and Austin, Texas (+53,000). Vancouver (+27,000), the highest Canadian metro area, placed 11th, while Toronto recorded growth of just 16,000 persons.
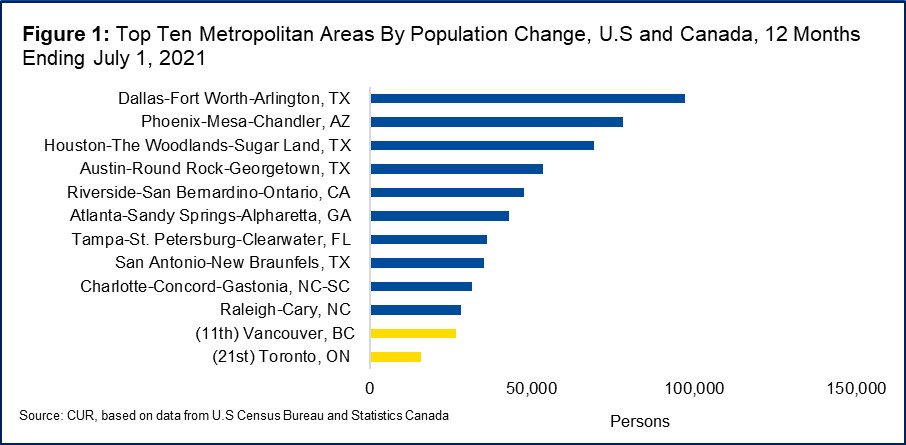
Nine of the ten fastest-growing metro areas in the U.S. are in the south, with Riverside, California, filling out the top ten.
Montreal joined the list of the top ten metro areas with a declining population in 2021
Figure 2 shows that Montreal (-25,000) was the 9th fastest contracting metro area in the U.S. and Canada. Among the largest contracting metro areas were New York (-328,000), Los Angeles (-176,000), San Francisco (-116,000) and Chicago (-92,000).
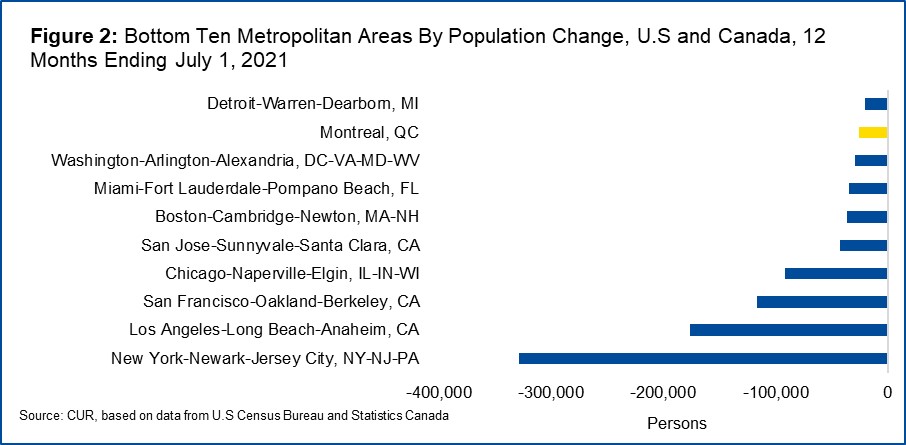
Reduced international migration and more net outflow of domestic migrants are behind Montreal’s population decline in 2021.
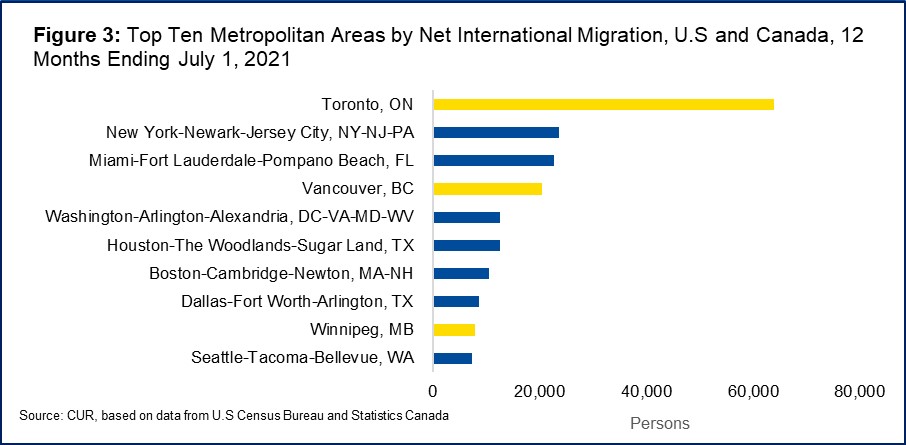
Toronto still attracts more net migrants from other countries than any other metro area in 2021 – Vancouver and Winnipeg are also in the top ten
Despite Toronto falling in the total population growth ranking in 2021, it remains the top metro area in the U.S. and Canada for international migration. Figure 3 shows Toronto’s net immigrants (+64,000) are more than double that of the following fastest-growing metro areas in the U.S. (New York with 24,000 and Miami with 23,000) and more than three times higher than Vancouver (20,000). However, the number of net international migrants fell sharply in 2021 from 2020 due to the pandemic.
Net domestic migration driving growth in the U.S.’s fastest-growing metro areas – no Canadian metro area made the top ten list
No Canadian metro area placed in the top ten for net gains from domestic migration (Figure 4). Phoenix (67,000) was followed by Dallas (54,000), which repeated their 2020 placement as number one and number two, respectively. Tampa (42,000) came in at number three.
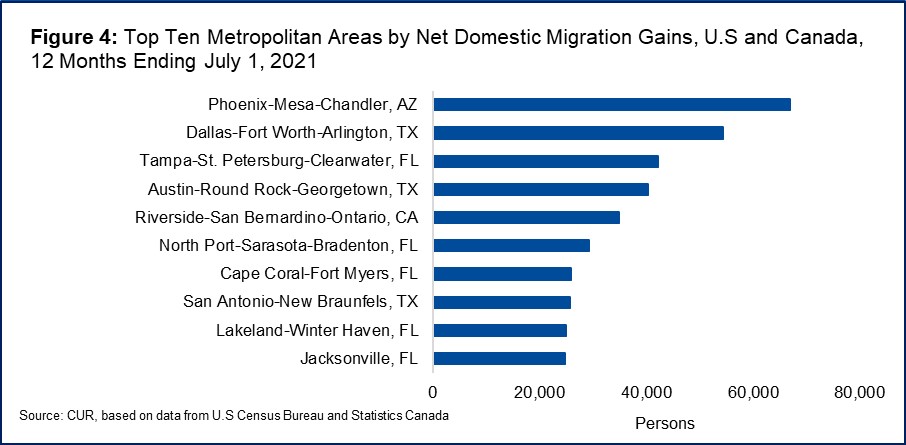
Five of the top ten metropolitan areas for net domestic migration gains are in Florida for 2021, and nine were in the southern U.S.
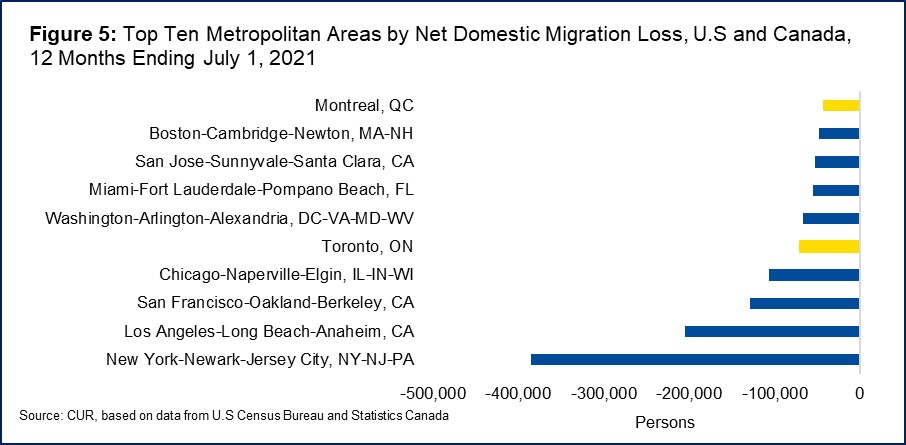
Toronto and Montreal are on the list of top ten metro areas experiencing net domestic migration losses in 2021
Domestic migration of residents to other parts of the province or country has continued to lead to population loss for Toronto and Montreal. Figure 5 shows that Montreal (-44,000) rounded out the list at number ten, with Toronto (-71,000) placing fifth. New York City (-385,000), Los Angeles (- 205,000), San Francisco (-128,000) and Chicago (-107,000) all saw the most significant losses in the number of domestic migrants.
Sources:
[1] Metropolitan areas refer to the official statistical definitions of metropolitan areas used by the U.S. Census Bureau (Metropolitan Statistical Area - MSA) and by Statistics Canada (Census Metropolitan Area – CMA), respectively. The appendix includes the two definitions.
Frank Clayton, Ph.D., is Senior Research Fellow at Toronto Metropolitan University’s Centre for Urban Research and Land Development (CUR) in Toronto.
Ryan Kyle, B.HK., is a Research Assistant at Toronto Metropolitan University’s Centre for Urban Research and Land Development (CUR) in Toronto.
![]()
Appendix: Defining Canadian and U.S. Metropolitan Areas
A Canadian Census Metropolitan Area (CMA) is formed by one or more adjacent municipalities centered on a population center (known as the core). A CMA must have a total population of at least 100,000 of which 50,000 or more must live in the core.
1) The adjacent areas to the urban core are included in the CMA if:
2) 50% of the resident population commute into the core for work; and
3) 25% of the jobs are filled by commuters from the core; OR
4) The municipality directly touches or is partly within the urban core.
A US. Metropolitan Statistical Area (MSA) includes a central county that has at least 50% of its population living in an urban core with a population of 50,000 or more. Surrounding counties are included in the MSA if:
1) 25% of the resident population commute into the central county(ies) for work; and
2) 25% of the jobs are filled by commuters from the central county(ies).
Because of the varying definition, U.S. MSAs tend to be larger in geography and population than Canadian CMAs.