The Greater Golden Horseshoe Growing Slower Than Forecast Largely Due to City of Toronto and Peel Region
By: Diana Petramala and Frank Clayton
March 3, 2022
(PDF file) Print-friendly version available
Statistics Canada released the first trench of data from the 2021 Census of Canada on February 9th. The data included population counts for 2021 and 2016.1 This allows us to track how the municipalities of the Greater Golden Horseshoe (“GGH”) are growing relative to prior-released Statistics Canada’s annual population estimates and the forecasts of population produced for the Ministry of Municipal Affairs and Housing by Hemson Consulting from August of 2020 for the same five-year period.2
The Census of Canada data showed that the population of the GGH grew by almost 516,000 people between 2016 and 2021, well below the initial estimates of 700,000 from Statistics Canada’s annual population estimates released earlier this year and the Hemson forecast of 770,000. Most of the difference was in the population counts for the city of Toronto and Peel region where census population growth was less than half of what was expected. The fact the Census of Canada figures exclude population undercount while the other two sources include an undercount estimate accounts for only a part of the observed differences.
Understanding the three sources of population data
This section provides a brief description of the three data sources examined:
- The Census of Canada population counts. The Census of Canada is conducted by Statistics Canada every five years. It is a survey sent out to be filled out by every household in Canada in May of the census year and was last conducted in May 2021.
The Census of Canada can fail to count people for several reasons, thus undercounting the actual population. Statistics Canada will be conducting postcensal coverage studies to estimate what the undercount is by municipality and will be issuing population counts adjusted for undercount in a couple of years.
- Annual Population estimates. Between census years, Statistics Canada uses administration data (immigration data, personal tax information, birth and death registrations) to generate annual population estimates. The data is tallied on July 1st and released in January or February of the following year. Statistics Canada released annual population estimates for Canada and its sub regions as of July 1st, 2021, and for the other years following the 2016 Census of Canada earlier this year.
The annual population estimates will be revised to reflect the Census of Canada results and undercount estimates. Revised annual data for the 2016-2021 period are scheduled to be available in September 2023.3
- Hemson Consulting’s 2020 population forecast for the GGH was released as background for the Growth Plan for the Greater Golden Horseshoe amendments made that year. Hemson relied on the Statistics Canada annual population estimates as input into its forecast. At that time, they had three years of data from the annual population estimates.
Census of Canada shows the GGH growing slower than expected
Figure 1 presents the change in the population between 2016 and 2021 for the GGH and its single-tier and upper-tier municipalities. These municipalities are all categorized as Census Divisions by Statistics Canada.
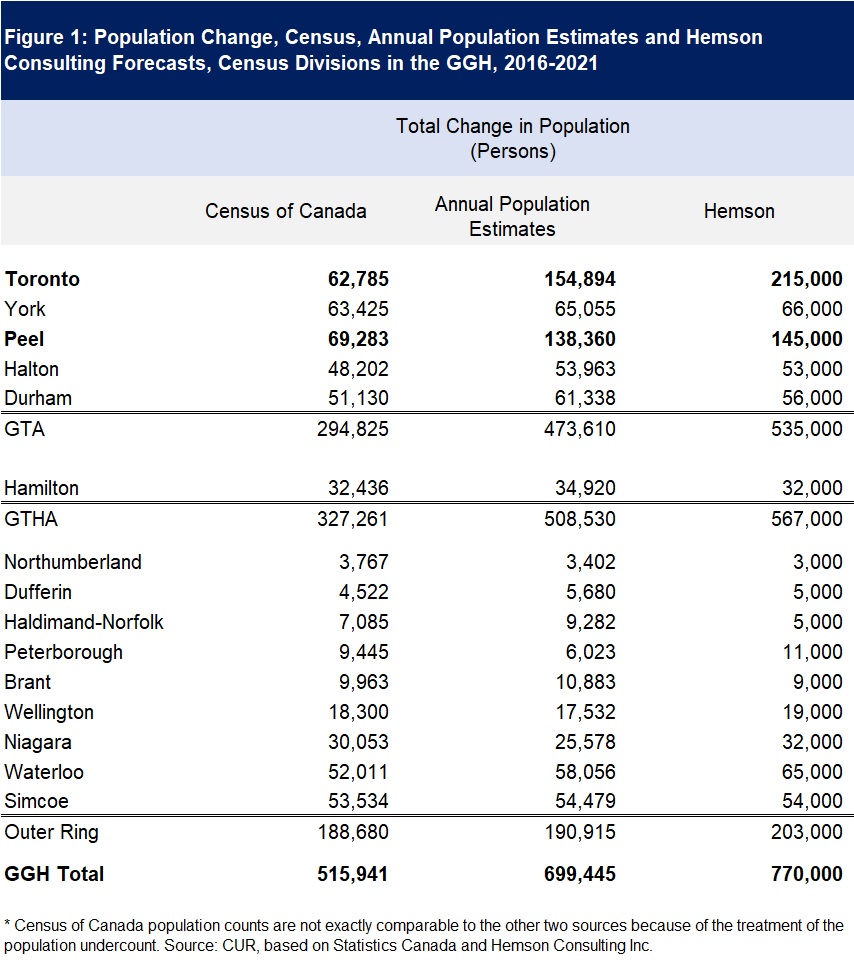
Highlights from Figure 1 include:
- Hemson anticipated the GGH population would grow by 770,000 people between 2016 and 2021;
- The annual population estimates of Statistics Canada showed a growth of roughly 700,000 people in population for the GGH for 2020 and 2021– 10% lower than the Hemson forecast and incorporated estimates of the impact of the pandemic; and
- The 2021 Census of Canada records that the GGH population increased by just 516,000 people over this five-year period, almost 200,000 people less than the Hemson forecast.
Biggest differences were in city of Toronto and Peel region
Figure 1 shows that the major differences (almost 95%) between the Census of Canada counts and the annual population estimates and the Hemson forecast were concentrated in the city of Toronto and Peel region:
- The Census of Canada showed that the population in the city of Toronto grew by 63,000 persons between 2016 and 2021, compared to 155,000 first released in the annual population estimates and the 215,000 forecast by Hemson Consulting; and
- The population of Peel region grew by 69,000 persons per year according to the Census of Canada, compared to 138,000 in the annual population estimates and 145,000 as forecast by Hemson.
Smaller absolute differences in the Durham, Peterborough, Niagara, and Wellington census divisions4
- The third largest disparity was in Durham, where the Census of Canada pointed to population growth of 51,000 persons versus 61,000 from the population estimates;
- The Census of Canada pointed to faster population growth in Peterborough, Niagara and Wellington census divisions than as seen in both the annual population estimates and the Hemson forecast; and
- The disparity in most other regions ranged from 1,000 to 5,000 persons.
Conclusion
Ultimately, the annual population estimates will be revised to account for the 2021 Census of Canada undercount. We will not know the actual population growth until the revised data come out in September 2023. However, using history as a guide, we can estimate that the annual population estimates between 2016 and 2021 will be revised significantly lower:
- Population undercounts have historically ranged between 2% and 4%. The undercount for the GGH was roughly 3% in 2016; and
- The average downward revision made to annual population estimates after the prior four census (2001, 2006, 2011 and 2016) was roughly 15,000 people per year. In other words, preliminary population estimates have generally overestimated.
Assuming an increase in the 2021 undercount to 4% from about 3% in 2016, to allow for difficulties in conducting the Census of Canada during a pandemic only increases the Census counts to about 600,000 persons for GGH growth between 2016 and 2021. This is still some 100,000 people fewer than the growth reported in the annual population estimates and 170,000 fewer than the forecast of Hemson Consulting.
Most of the slower growth has occurred through a reduction in immigration owing to the pandemic. This has resulted in less demand for rental housing, particularly in the city of Toronto where the rental vacancy rate increased. However, the slower population growth was less noticeable in municipalities with lower density housing and further from the downtown core. In fact, some outer ring municipalities are growing faster than expected.
![]()
Sources:
[1] These population counts are not adjusted for population undercounting.
[2] Statistics Canada (2022). ‘Table 98-10-0007-01: Population and dwelling counts: Canada and census divisions.’ [Online] Available: https://www150.statcan.gc.ca/t1/tbl1/en/tv.action?pid=9810000701 (external link) . Hemson Consulting (2020). “Greater Golden Horseshoe: Growth Forecasts to 2050.” [Online] Available: (PDF file) https://www.hemson.com/wp-content/uploads/2020/08/HEMSON-GGH-Growth-Outlook-Report-26Aug20.pdf (external link) . These latter two sources include an estimate for population undercount.
[3] Statistics Canada (2022) ‘Differences between Statistics Canada's census counts and population estimates.’ [Online] Available at: https://www.statcan.gc.ca/en/hp/estima (external link) .
[4] The Census Divisions (CD) include separate all municipalities within it. For example, the Wellington CD includes both Wellington County and the independent City of Guelph.
Diana Petramala is Senior Economist at Toronto Metropolitan University’s Centre for Urban Research and Land Development (CUR) in Toronto.
Frank Clayton, Ph.D., is Senior Research Fellow at Toronto Metropolitan University’s Centre for Urban Research and Land Development (CUR) in Toronto